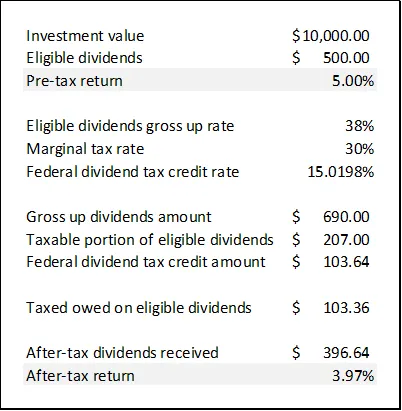
This chart shows a hypothetical calculation of after-tax investment returns.
This chart shows a hypothetical calculation of after-tax investment returns.
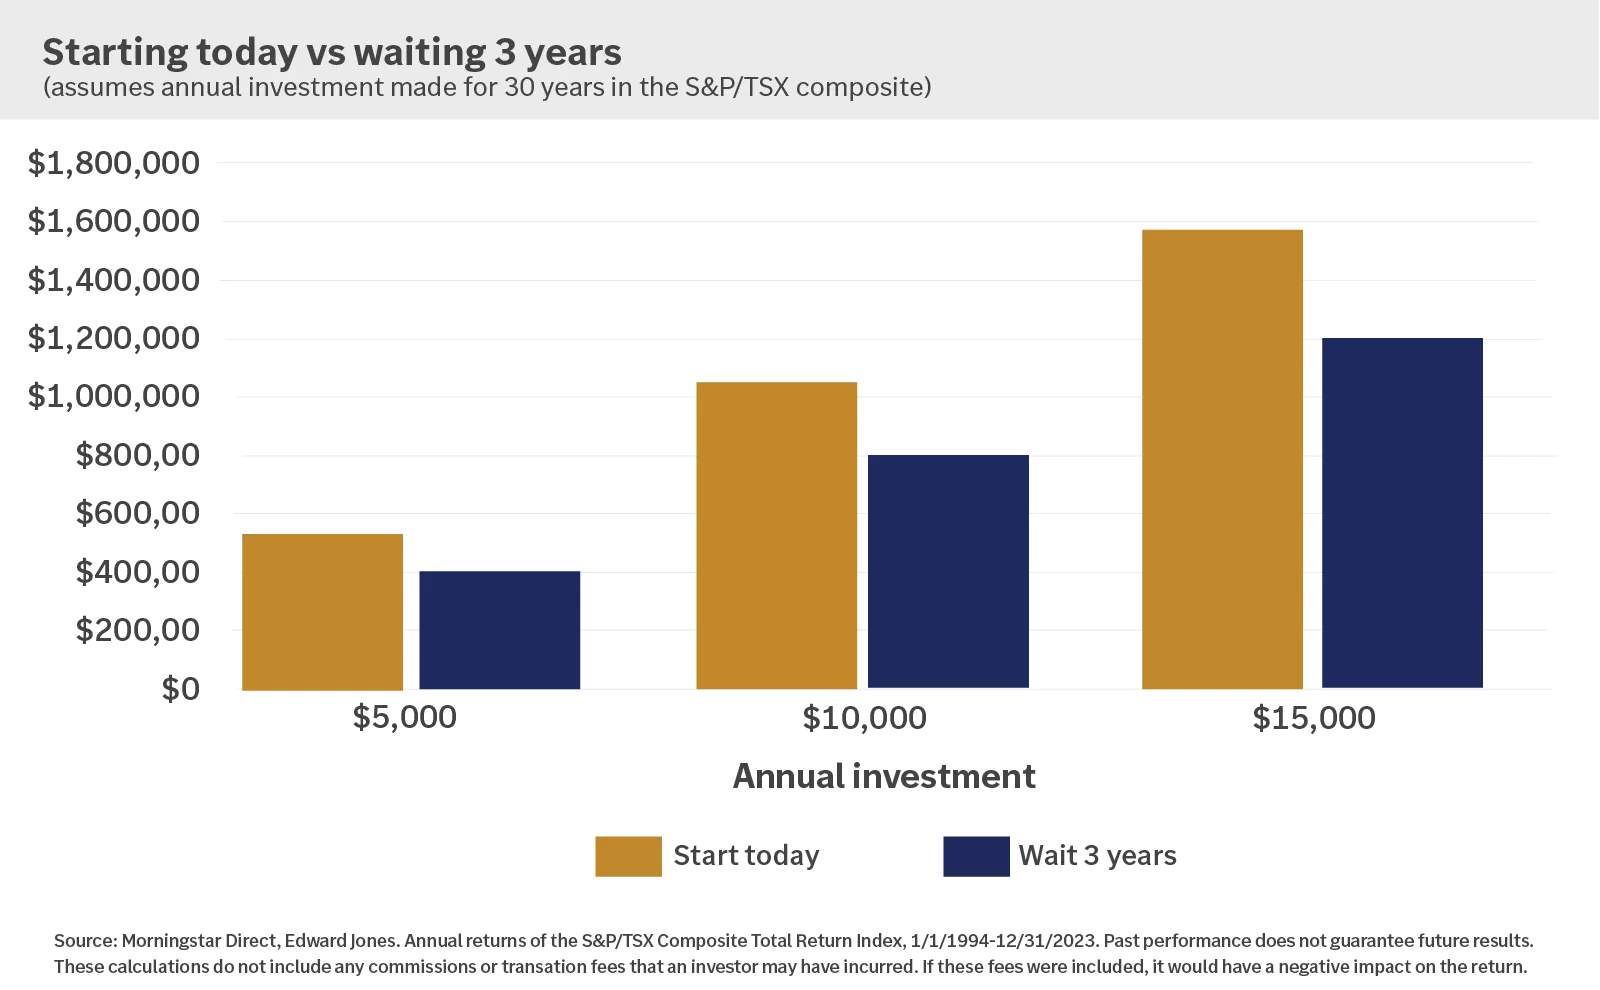
This chart shows that, over time, the cost of waiting to invest could be significant.
The chart demonstrates that generally the best time to invest is today, and that yesterday may have been even better.
This chart shows that, over time, the cost of waiting to invest could be significant.
The chart demonstrates that generally the best time to invest is today, and that yesterday may have been even better.
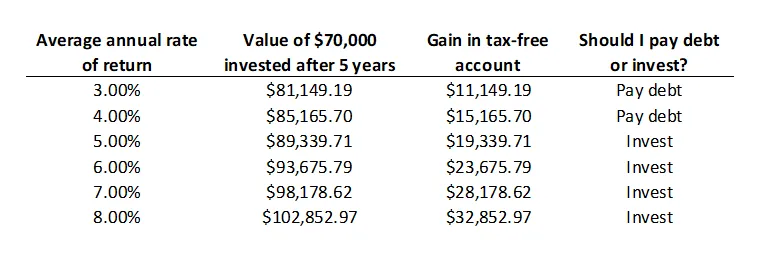
This chart shows the effects of investing $70,000 in a tax-advantaged account at a range of potential returns.
This chart shows the effects of investing $70,000 in a tax-advantaged account at a range of potential returns.
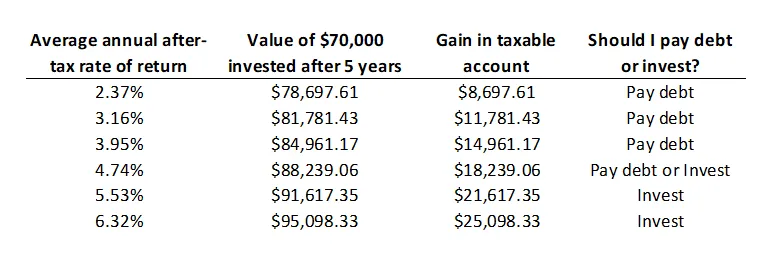
This chart shows the effects of investing $70,000 in a taxable at a range of potential returns.
This chart shows the effects of investing $70,000 in a taxable at a range of potential returns.
Important information:
1 This calculation can also be performed with monthly numbers by dividing annual numbers by 12.
2 $500 x 1.38 = $690.
3 30% x $690 = $207
4 15.0198% x $690 = $130.64
5 $207 – $103.64 = $103.36
6 $396.64 / $10,000 = 3.97%
7 Assumes 21% average tax rate, total capital gains below $250,000 in a given year and based on a portfolio consisting of 40% interest, 30% dividends and 30% capital gains income for a middle-income earner.