Will the rise in oil prices force the Fed's hand?
Key Takeaways:
- Renewed U.S.–Iran tensions are pushing oil back toward $100, reintroducing inflation risk and reopening the debate over whether the Fed and other central banks may need to respond.
- We think the Fed is likely to hold in July, but September is a live meeting, with a hike increasingly plausible if energy pressures persist and inflation remains sticky. The same risks will keep the BoC vigilant, but we believe the bank is comfortable staying on hold.
- We now see a higher-for-longer backdrop, with the 10-year GoC expected to trade in a 3.5%-4.0% range and the U.S. Treasury in a 4.5%–5.0% range. Long-term yields look attractive, but we also see relative value in short-term bonds given the meaningful yield pickup over cash.
- AI remains the dominant equity driver, but the debate appears to be shifting from spending to monetization and returns.
- Rising oil prices and higher yields represent an emerging risk heading into the seasonally softer August and September period, but underlying fundamentals remain constructive, in our view, supporting a cautiously optimistic outlook for the back half of the year.
In many ways, the year has progressed largely in line with expectations, with North America economic resilience persisting, the labour market stabilizing, AI-driven investment supporting growth, and fast-rising corporate profits driving equity gains. However, the outlook for interest rates shifted materially in the first half since geopolitical tensions in the Middle East emerged.
As we kick off the second half of the year, renewed hostilities and a re-escalation in the U.S.–Iran conflict are once again pushing oil prices toward $100, pressuring yields and bond prices. We examine how recent developments are reshaping the outlook for rates and the Fed ahead of the July meeting, and we provide our first read on tech earnings amid growing scrutiny of AI-related spending.
Oil and yields are pressing higher
A fresh round of escalation in the U.S.–Iran conflict is driving oil back toward the early June highs, reversing much of the progress made after the April ceasefire and the June 17 Memorandum of Understanding. Energy markets have, to some extent, defied earlier fears of a sharper spike, with countries drawing down inventories, softer Chinese demand, and alternative shipping routes helping keep supply flowing.
However, that resilience is now being tested again. The conflict appears to be widening, with Houthi attacks targeting Red Sea shipping routes and raising the risk of disruption to one of the key alternatives to the Strait of Hormuz, potentially further tightening the flow of oil.
In fixed income, bond markets are under pressure as yields continue to grind higher, with the 10-year Government of Canada yield (GoC) breaking above 3.60% for the first time since May and 30-year yields revisiting the year's highs, their highest levels since 2011. In many ways, this is déjà vu for markets: renewed strength in oil is reigniting inflation concerns and reopening the debate over whether the Fed and BoC may need to respond.
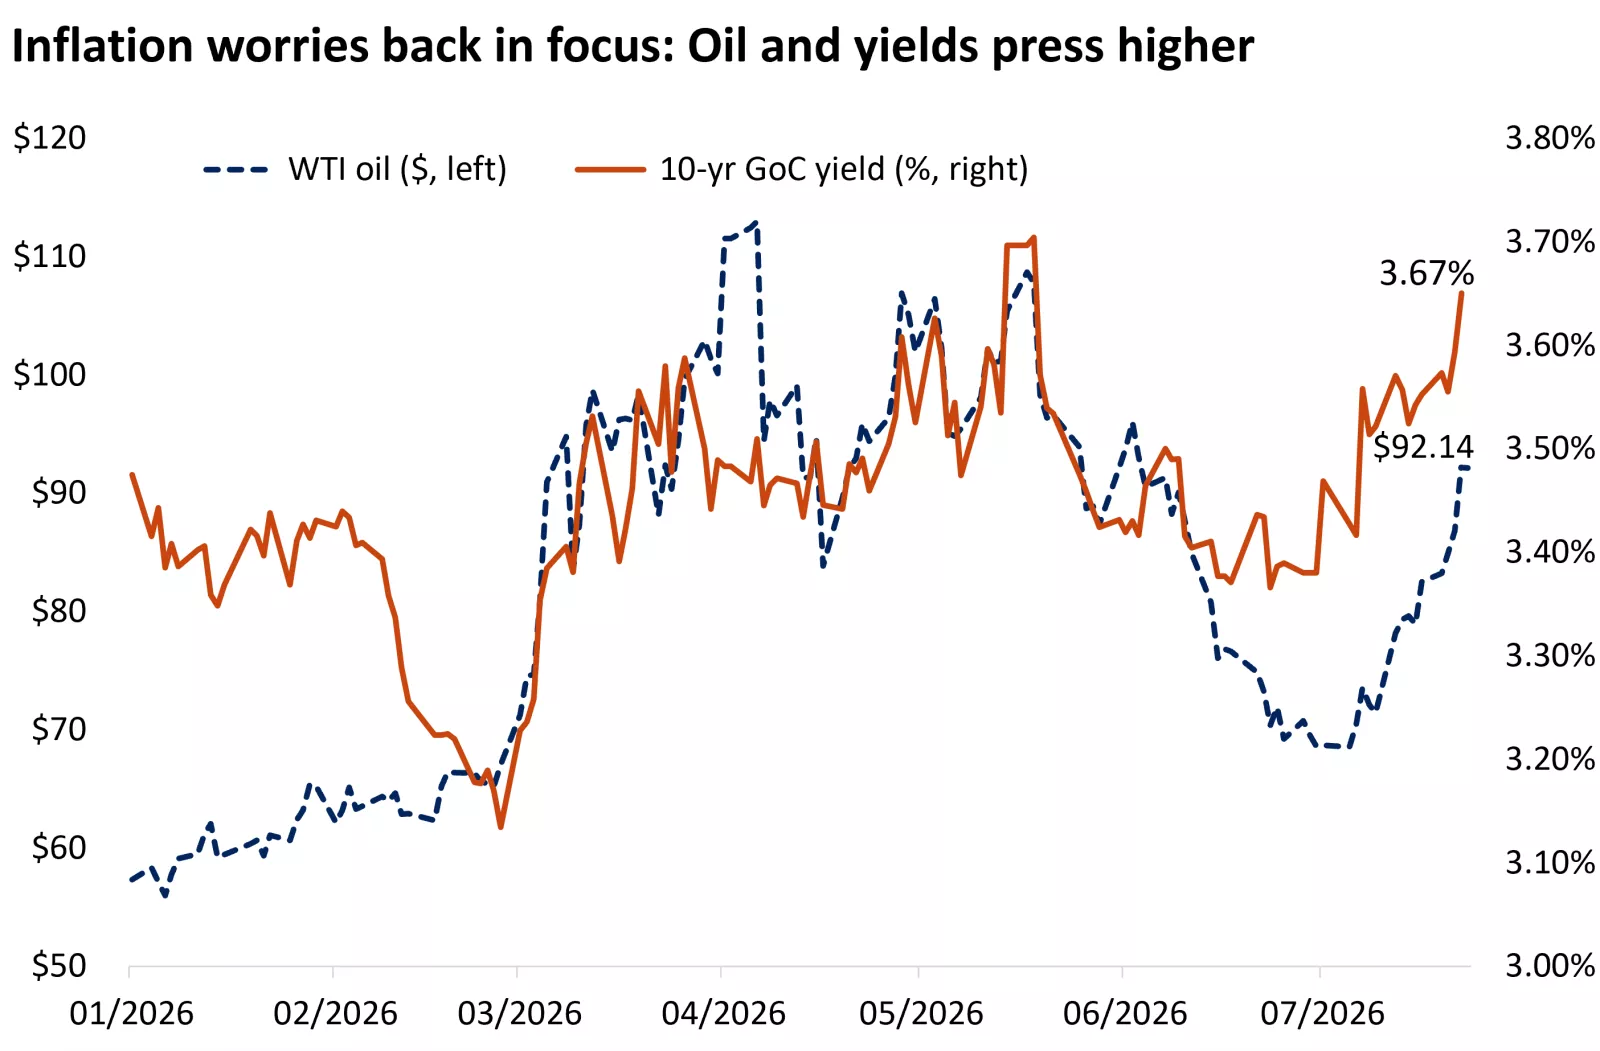
The graph shows that oil prices and bond yields have been rising together in response to the re-escalation of the conflict in the Middle East. Past performance does not guarantee future results.
The graph shows that oil prices and bond yields have been rising together in response to the re-escalation of the conflict in the Middle East. Past performance does not guarantee future results.
Not inevitable, but door for a rate hike is opening
The oil impact of the conflict on headline energy inflation is straightforward and supports the view that the consumer price index (CPI) may have peaked in May if oil prices do not break to new highs. However, the pass-through into core inflation—which excludes food and energy—is slower and more uncertain. The longer the conflict persists, the greater the risk of second-round effects, with pressures extending beyond energy into broader categories. Importantly, these new price pressures are arriving at a time when the Fed is emphasizing less patience after more than five years of above-target inflation.
With the next Fed decision on Wednesday, investors are closely watching for signals on the path forward. We think the soft consumer and producer inflation readings in June buy the Fed some time to assess how energy disruptions and inflation evolve over the summer. Housing-related inflation continues to cool, and wage growth—the largest input cost in services— is not inflationary when adjusted for productivity gains. Moreover, the new global tariffs announced are broadly consistent with the previous tariff levels that expired and should not trigger a renewed rise in goods prices, in our view.
That said, inflation is still too high for comfort, and prior concerns around labour-market weakness have further diminished. Last week’s initial jobless claims fell to 187,000, the lowest level since 1969, underscoring muted layoffs and a stable labour market. This gives hawkish members of the Fed committee more scope to focus on the inflation mandate.
Against that backdrop, we expect the Fed to hold rates steady at 3.50%–3.75% in July, though dissent is possible. September, however, looks more like a live meeting, with the probability of a rate hike rising, in our view, if the conflict persists and oil prices continue to trend higher. While tighter policy cannot offset a supply-driven inflation shock, it can help anchor inflation expectations at a time when growth is being supported by resilient consumer spending and an ongoing AI investment boom.
In Canada, the BoC left rates unchanged earlier this month at 2.25% for the sixth consecutive meeting. We think that the bank appears content for now to keep policy at the low end of its neutral range given the relatively benign core inflation readings, the soft labour-market conditions, and trade uncertainty.
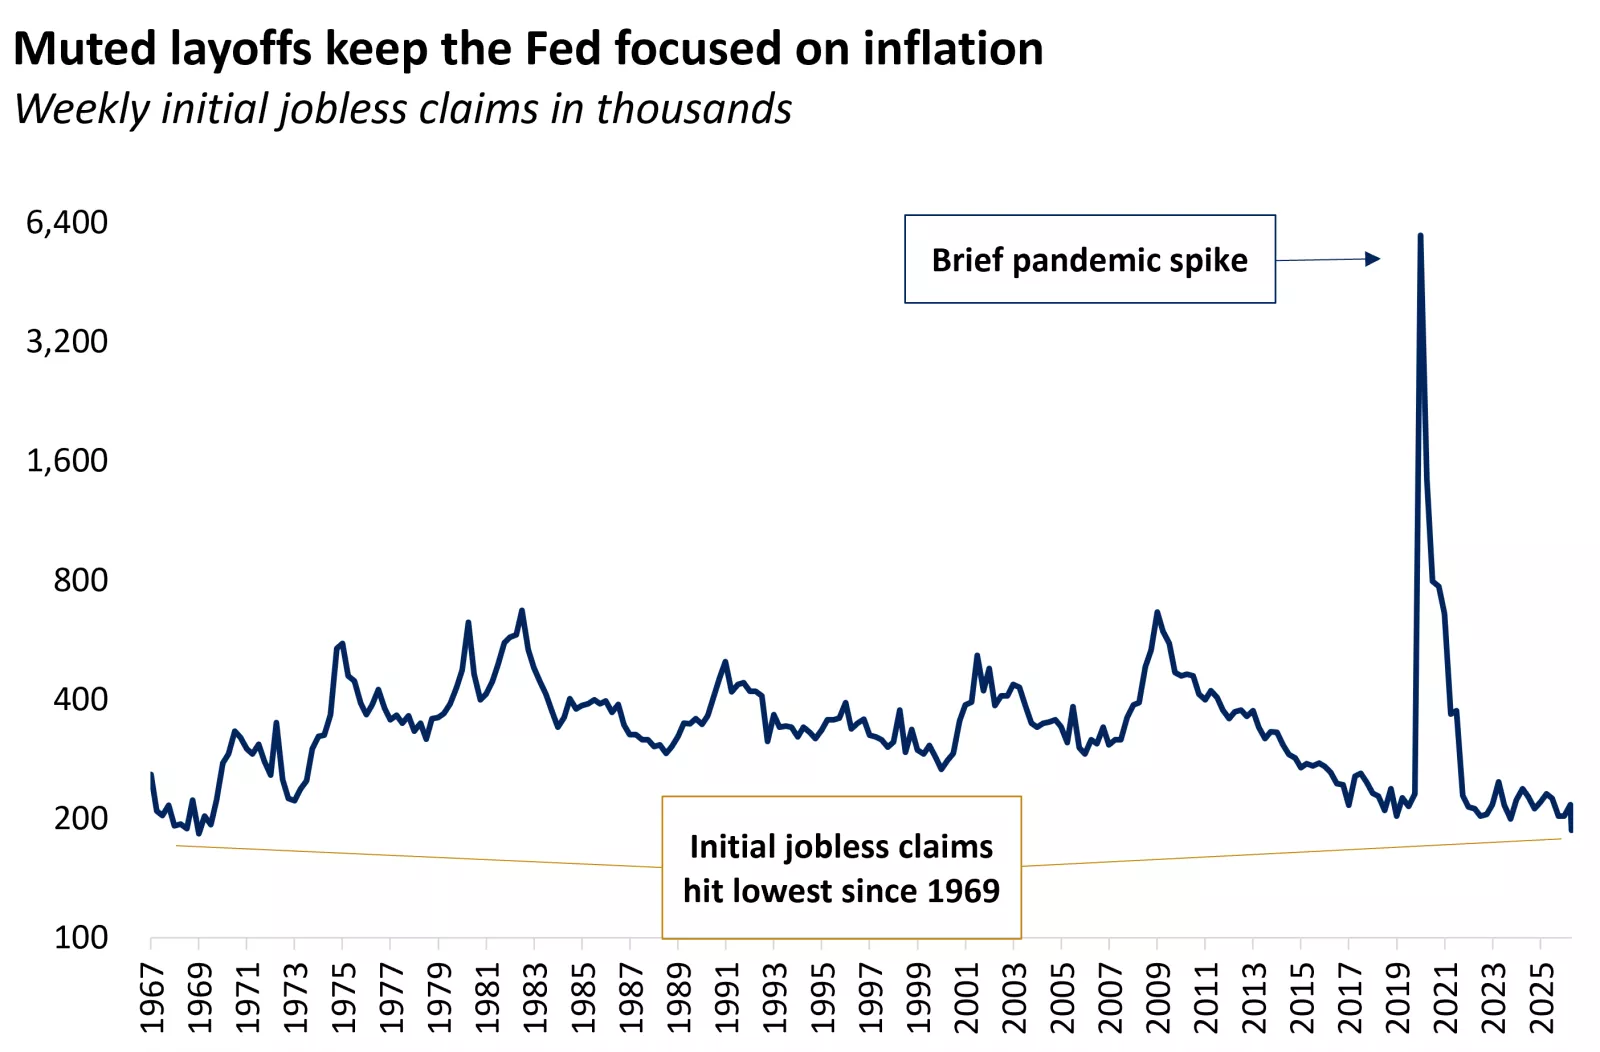
The graph shows that U.S. initial jobless claims are at their lowest since 1969.
The graph shows that U.S. initial jobless claims are at their lowest since 1969.
What's the bond market signaling?
At around 4.30%, the two-year Treasury yield is now exceeding the Fed policy rate by the widest margin since 2022, suggesting that the bond market is already pricing in the possibility of rate hikes. Indeed, fed funds futures assign a 33% chance of a July hike and 100% probability of one quarter-point hike by September.
If the Fed ultimately validates those expectations, the next question likely becomes the scope for further tightening. Even if a hike materializes in September, we think markets will view it as a mid-cycle adjustment rather than the start of a renewed tightening cycle. Unlike 2022, when policy lagged a sharp inflation acceleration and forced the Fed into catch-up mode, current policy is aligned with the inflation backdrop, with the fed funds rate largely matching the pace of price growth.
Other major central banks are navigating a similar dynamic, with policy paths increasingly dependent on the trajectory of the U.S.–Iran conflict and energy prices. The European Central Bank (ECB) held rates steady last week after its June hike, but signaled that another move in September remains on the table. As a result, markets are now nearly fully pricing in two additional ECB rate hikes by year-end.
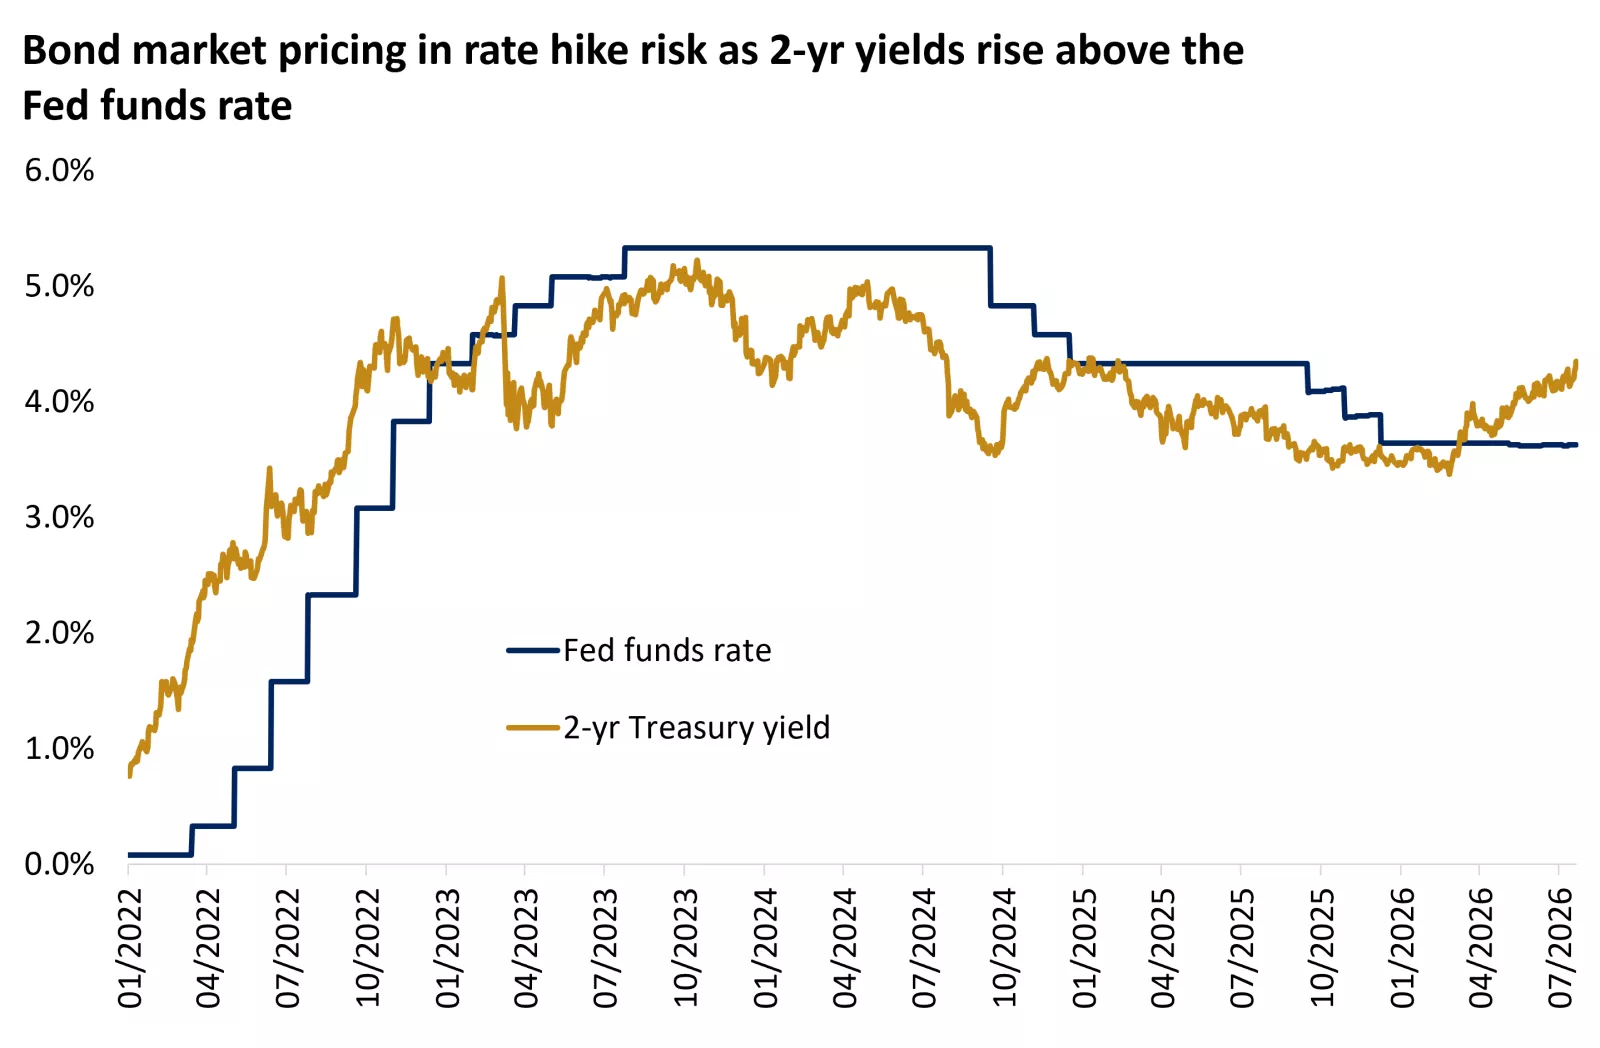
The graph shows that the two-year Treasury yield is now above the Fed's policy rate, reflecting expectations for upcoming rate hikes. Past performance does not guarantee future results.
The graph shows that the two-year Treasury yield is now above the Fed's policy rate, reflecting expectations for upcoming rate hikes. Past performance does not guarantee future results.
Fixed income implications of a "higher for longer" rate environment
Inflation concerns and central bank uncertainty do not make for a bond-friendly backdrop, and this year’s performance of higher-quality investment-grade bonds reflects that reality. The Canada and U.S. Aggregate Bond Indexes are now down for the year, lagging returns on cash and money market funds.
Current yields look attractive for those seeking income, as 10-year yields are near the high end of the past 20-year range. However, we think returns over the next 12 months will be driven primarily by coupon rather than price appreciation. On the other end, short-term bonds offer value, in our view, as the yield pickup over cash remains compelling. For example, 2-year GoC yields currently offer roughly a 0.58% advantage over 3-month bills, a proxy for money market rates.
To reflect the renewed energy-driven inflation pressures from the U.S.–Iran conflict and the Fed’s heightened sensitivity to upside inflation surprises, we are raising our expected range for where the 10-year GoC yields may trade over the remainder of the year to 3.5%-4.0% (from 3.0%-3.5%) and 4.5%–5.0% (from 4.0%–4.5%) in the U.S.
AI narratives remain in the driver's seat for stocks
On the equity side, we think higher rates might start pressuring valuations, which, though, are not at extremes, as earnings have been rising faster than prices this year. Outside of the S&P 500, most asset classes trade roughly in line with their 10-year average price-to-earnings multiple, with even many mega-cap tech names trading at a relative discount to the index.
Sentiment around AI continues to shape the market narrative, as scrutiny on tech spending led to further weakness in recent sessions. Alphabet was the first major tech company to report quarterly results, with Amazon, Meta and Microsoft following this week. Alphabet delivered results that exceeded expectations, with cloud revenue rising 82% year-over-year and backlog expanding meaningfully, underscoring robust demand for AI infrastructure and solutions. However, the solid results were overshadowed by the spending guidance, as the company raised its 2026 capital expenditure estimate to $195 billion–$205 billion, up from a prior range of up to $190 billion.
As we move through a critical stretch of tech earnings, we expect that investors will be focused on whether companies can translate elevated AI investment into higher revenue, stronger margins, and expanding cash flow. In our view, the AI theme is maturing rather than breaking. Demand trends remain intact, and the cycle is still early in terms of adoption and dissemination. However, we think the next chapter in markets will be less about riding the wave and more about monetization.
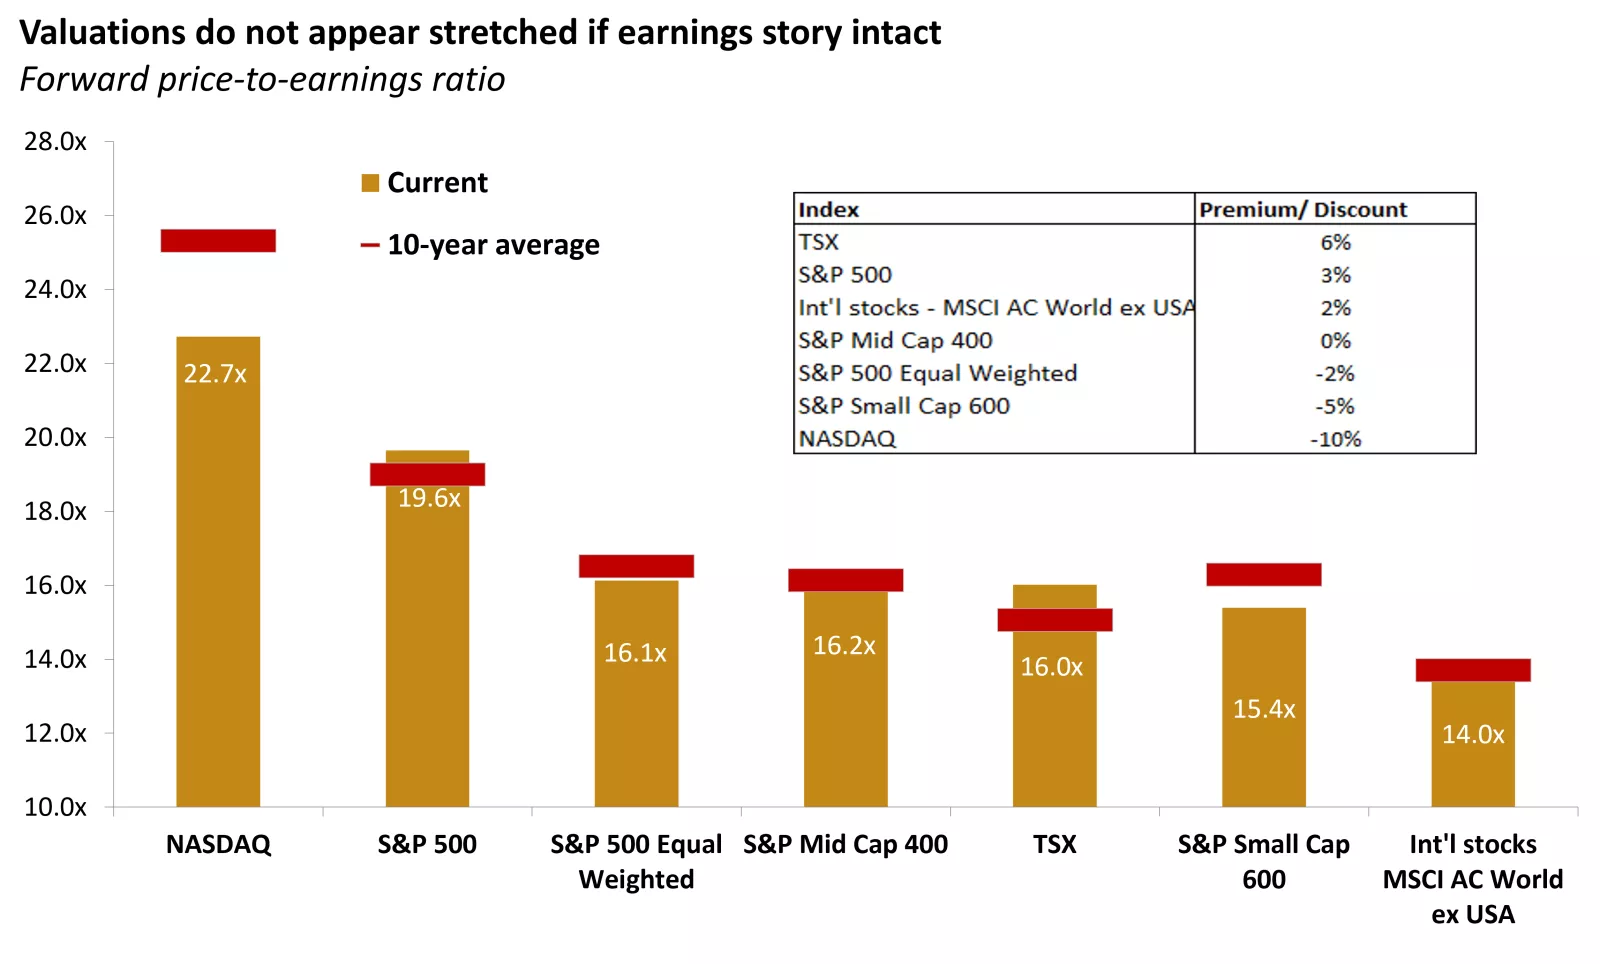
The graph shows forward price-to-earnings multiples, a common measure of valuations, across various asset classes. Past performance does not guarantee future results. An index is unmanaged, cannot be invested into directly and is not meant to depict an actual investment.
The graph shows forward price-to-earnings multiples, a common measure of valuations, across various asset classes. Past performance does not guarantee future results. An index is unmanaged, cannot be invested into directly and is not meant to depict an actual investment.
The bottom line
We believe rising oil prices and higher yields represent an emerging risk that could influence the policy paths for central banks in the months ahead and contribute to greater market volatility as we head into the seasonally softer August and September period. However, underlying economic and corporate fundamentals remain constructive, in our view, supporting a cautiously optimistic outlook for the back half of the year.
We continue to recommend maintaining exposure to AI-related allocations, while complementing them with more diversified and differentiated sources of return, in line with investors' risk and return preferences. For cyclical exposure, we favour Canadian small- and mid-caps, industrials, and the two resource sectors (industrials and materials). For AI exposure, we like a combination of U.S. and emerging-market equities, while we expect rotations both within and beyond tech.
Angelo Kourkafas, CFA
Senior Global Investment Strategist
Sources for all data in commentary: Bloomberg, FactSet
Angelo Kourkafas
Angelo Kourkafas is responsible for analyzing market conditions, assessing economic trends and developing portfolio strategies and recommendations that help investors work toward their long-term financial goals.
He is a contributor to Edward Jones Market Insights and has been featured in The Wall Street Journal, CNBC, FORTUNE magazine, Marketwatch, U.S. News & World Report, The Observer and the Financial Post.
Angelo graduated magna cum laude with a bachelor’s degree in business administration from Athens University of Economics and Business in Greece and received an MBA with concentrations in finance and investments from Minnesota State University.


Important information:
The Weekly Market Update is published every Friday, after market close.
This is for informational purposes only and should not be interpreted as specific investment advice. Investors should make investment decisions based on their unique investment objectives and financial situation. While the information is believed to be accurate, it is not guaranteed and is subject to change without notice.
Investors should understand the risks involved of owning investments, including interest rate risk, credit risk and market risk. The value of investments fluctuates and investors can lose some or all of their principal.
Past performance does not guarantee future results.
Market indexes are unmanaged and cannot be invested into directly and are not meant to depict an actual investment.
Diversification does not guarantee a profit or protect against loss.
Systematic investing does not guarantee a profit or protect against loss. Investors should consider their willingness to keep investing when share prices are declining.
Dividends may be increased, decreased or eliminated at any time without notice.
Special risks are inherent to international investing, including those related to currency fluctuations and foreign political and economic events.
Before investing in bonds, you should understand the risks involved, including credit risk and market risk. Bond investments are also subject to interest rate risk such that when interest rates rise, the prices of bonds can decrease, and the investor can lose principal value if the investment is sold prior to maturity.