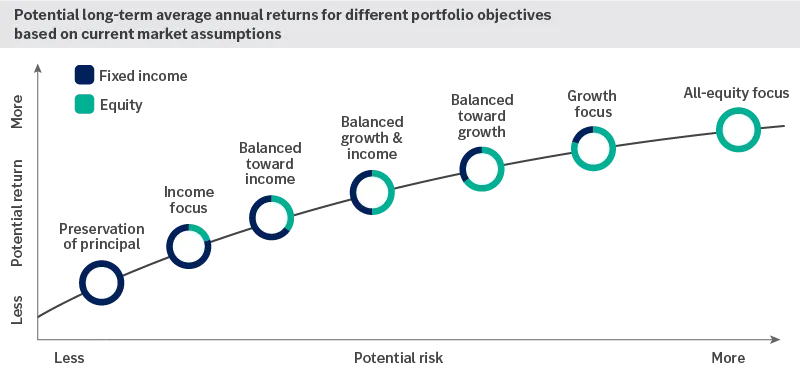
This chart shows the potential long-term average annual returns for different portfolio objectives based on our current market assumptions.
This chart shows the potential long-term average annual returns for different portfolio objectives based on our current market assumptions.
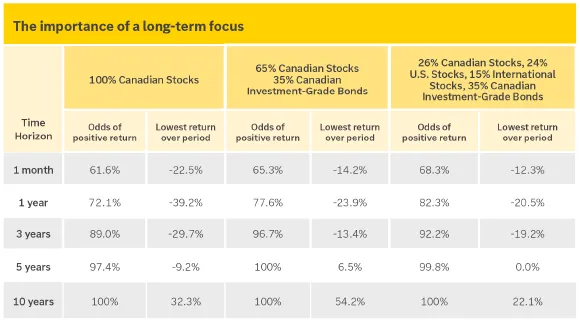
This chart shows how the historical returns of a hypothetical portfolios have higher odds of a positive return over longer time horizons.
This chart shows how the historical returns of a hypothetical portfolios have higher odds of a positive return over longer time horizons.
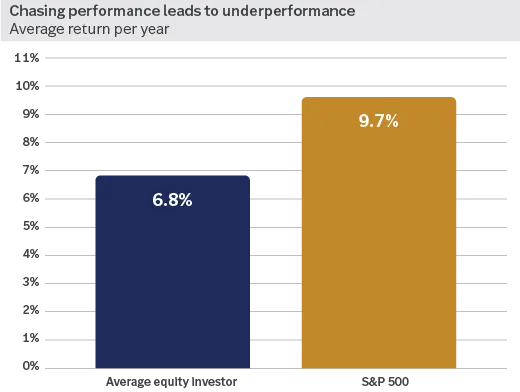
This chart shows that, historically, the average equity investor has underperformed the S&P 500.
This chart shows that, historically, the average equity investor has underperformed the S&P 500.
Important information:
1 Source: “Determinants of Portfolio Performance II: An Update,” Gary P. Brinson, Brian D. Singer and Gilbert L. Beebower, Financial Analysts Journal, 1991.
2 Morningstar Direct. S&P/TSX Composite Index; 1/3/1977 - 12/31/2022. Past performance does not guarantee future results. Market indexes are unmanaged and cannot be invested into directly and are not meant to depict an actual investment.