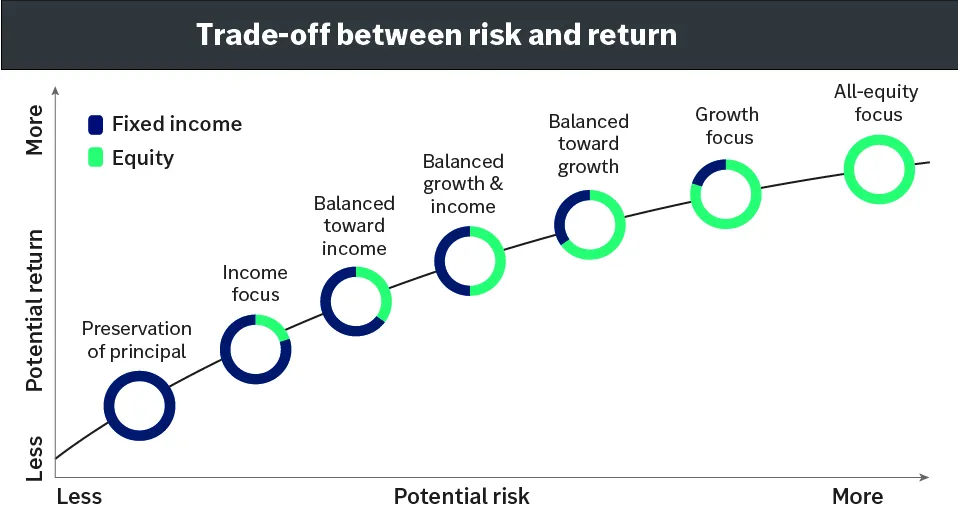
This chart shows the greater the potential risk, the greater the potential return and vice versa. It uses a line that starts where the lowest risk and return meet and rises up to where the greatest risk and return meet. Portfolio objectives are indicated along the way that align with the combination of risk and return. reservation of principal is the portfolio objective that represents the lowest combination of risk and return; the second lowest combination is Income focus; the next lowest is Balanced toward income; the next up is Balanced growth & income; nearing the top where the highest risk and return meet is Growth focus; and the lastportfolio objective offering the greatest combination of risk and return is All-equity focus.
This chart shows the greater the potential risk, the greater the potential return and vice versa. It uses a line that starts where the lowest risk and return meet and rises up to where the greatest risk and return meet. Portfolio objectives are indicated along the way that align with the combination of risk and return. reservation of principal is the portfolio objective that represents the lowest combination of risk and return; the second lowest combination is Income focus; the next lowest is Balanced toward income; the next up is Balanced growth & income; nearing the top where the highest risk and return meet is Growth focus; and the lastportfolio objective offering the greatest combination of risk and return is All-equity focus.
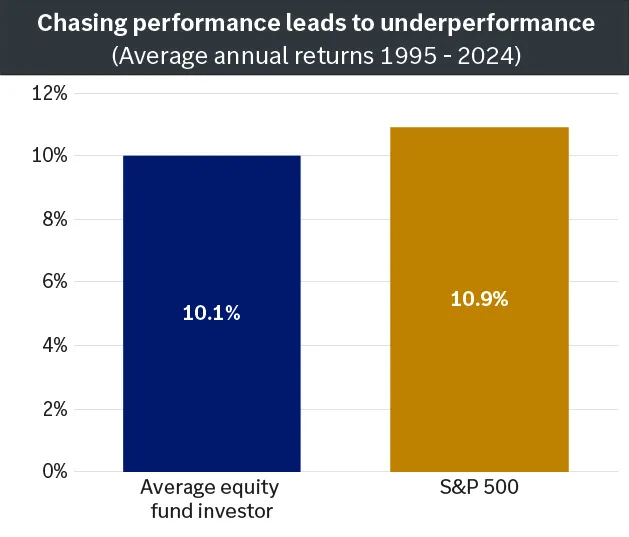
This is a bar graph that shows the average equity investor realized a 6.81% average annual return for the past 30 years (from 1/1/1994 – 12/31/2024) compared to the S&P Index, which achieved a 9.65% average annual return during the period.
This is a bar graph that shows the average equity investor realized a 6.81% average annual return for the past 30 years (from 1/1/1994 – 12/31/2024) compared to the S&P Index, which achieved a 9.65% average annual return during the period.
Important information:
Past performance does not guarantee future results. The TSX is an unmanaged index and cannot be invested into directly. Diversification does not guarantee a profit or protect against loss.