Don't fear the bear
When stock prices begin falling dramatically, you may become concerned and feel like your only option is to sell to limit losses. We disagree.
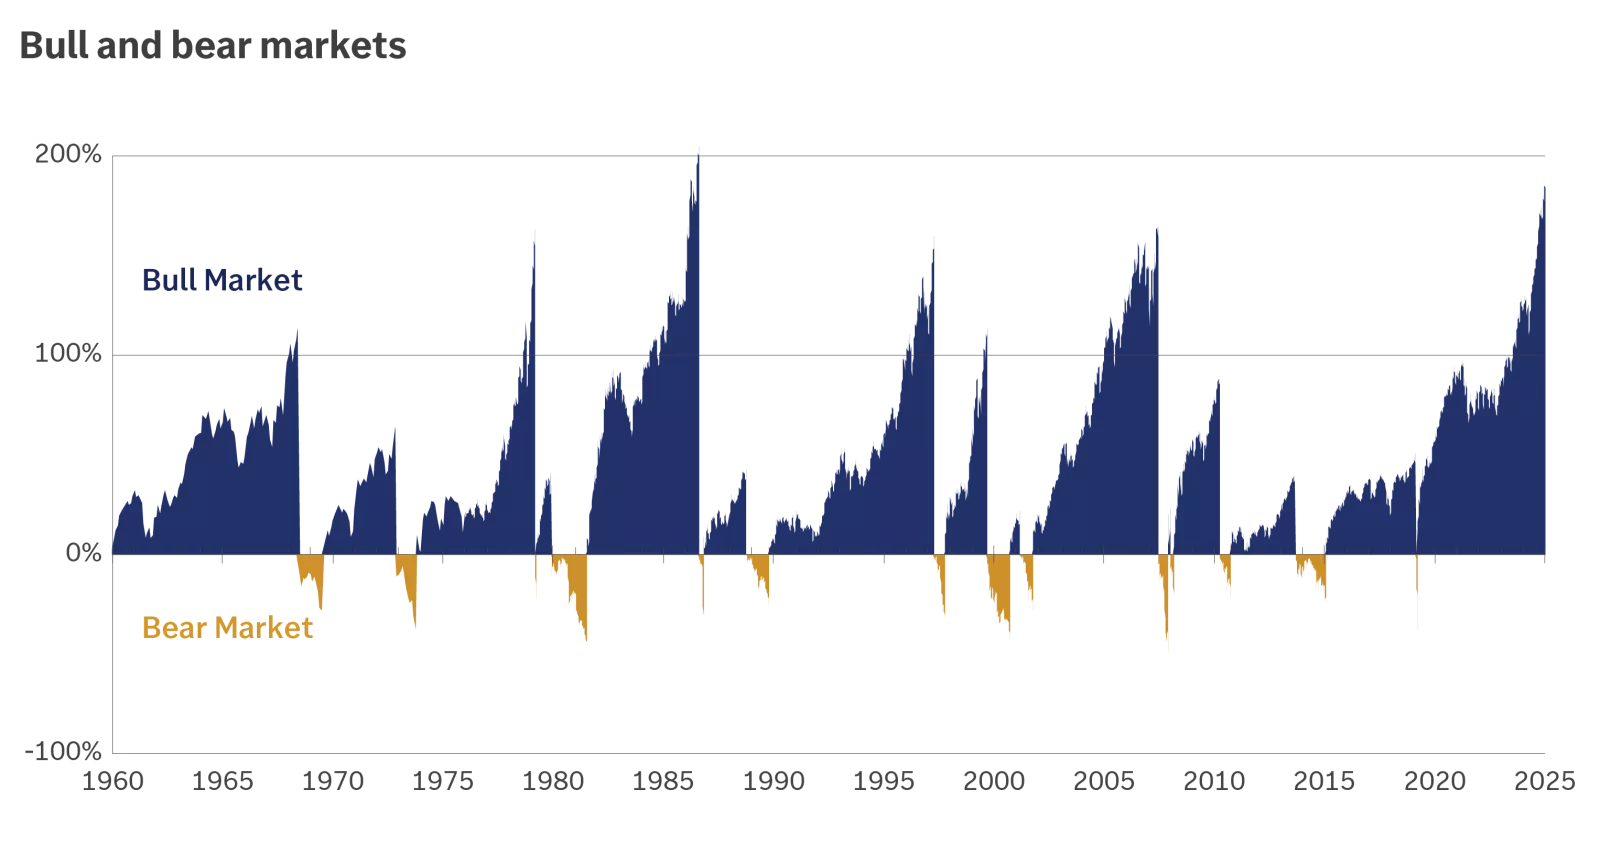
This chart shows that bear markets in the TSX since 1960 have been shorter on average than bull markets.
This chart shows that bear markets in the TSX since 1960 have been shorter on average than bull markets.
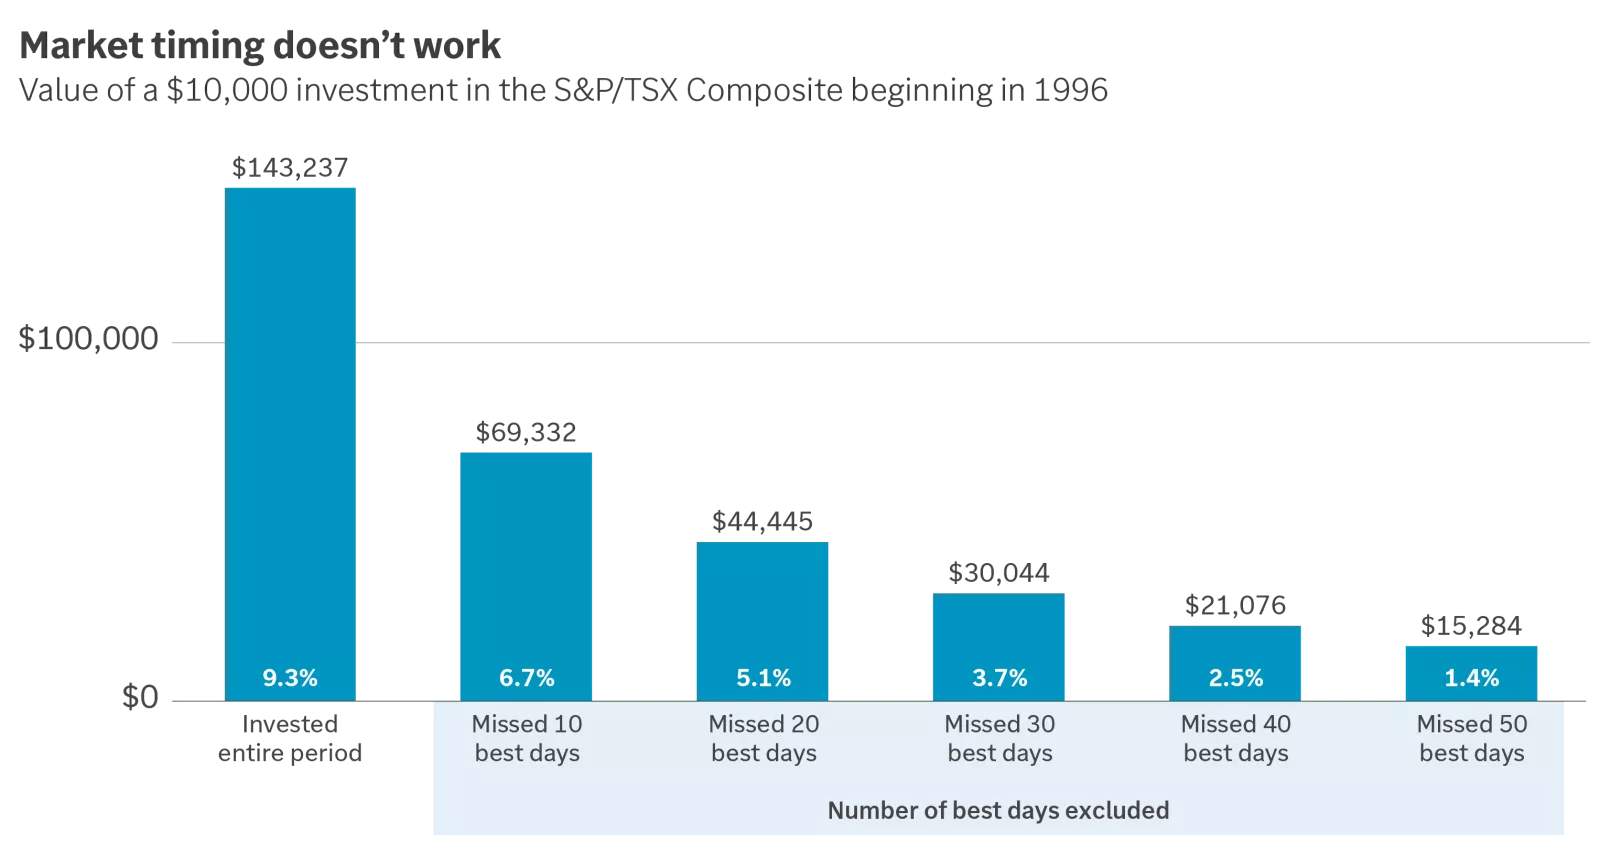
This chart shows how returns can be reduced how if you miss some of the best days in the market.
This chart shows how returns can be reduced how if you miss some of the best days in the market.
Important information:
Investors should understand the risks involved in owning investments, including interest rate risk, credit risk and market risk. The value of investments fluctuates, and investors can lose some or all of their principal.
1 Morningstar Direct. S&P/TSX Composite Index; 1/3/1977 - 12/31/2025. Past performance does not guarantee future results. Market indexes are unmanaged and cannot be invested into directly and are not meant to depict an actual investment.
2 Bear markets since 1977. Bear market defined as a peak to trough of 20% or more in the S&P/TSX Composite.
3 Sources: Edward Jones calculations, Morningstar Direct, Factset, S&P/TSX Composite; 1/3/1960 - 12/31/2025. Past performance does not guarantee future results.