Putting your performance into perspective
Understanding your performance in the context of your long-term goals can help you determine if you're on track to create the future you want.
Are you on track to achieve your financial goals?
To answer the question, "How am I doing?" we believe there are a few things to consider and a process you can follow.
1. Revisit your expectations
Reviewing your investment performance over time is important to help determine if you’re on track to achieve your financial goals and understand the adjustments you can make to give you more control. But before you can evaluate performance, you first need to determine your return expectations and then balance those expectations with your willingness, your ability and your need to take risk to achieve your goals.
To help put your investment performance into perspective, your return expectations should be:
- Relevant – Base your expectations on the goals you've set for yourself and your family (not a market index).
- Realistic – The type of investments you own, your comfort level with risk, the market environment and your investment time horizon are all factors in how your portfolio will perform, and it's important to focus on what you can control.
When evaluating performance, you should also revisit and evaluate:
- The role of the investments in your portfolio – Each investment in your portfolio has a purpose, and it's important to understand its purpose within the context of your diversified portfolio. For example, an investment may provide current income, growth potential, enhanced stability or other benefits to your portfolio. Diversification is important in helping you achieve your performance expectations over the long term.
- Appropriate time frames aligned with your goals – Longer-term periods, rather than short-term performance, provide a better indication of how an investment is performing. Short-term declines in value won't necessarily prevent you from achieving your goal. It's important to consider an investment's return, and its volatility over time, to help you stay on track toward your long-term goals.
- Cost basis – Your cost basis can help you better understand your possible gain or loss if you sell the investment, which could have tax implications.
2. Determine how you've been doing relative to your expectations
In addition to regular reviews with your financial advisor, accessing your account information online is a key tool for keeping up to date on the status and performance of your Edward Jones accounts. Your personal rate of return can be used to compare how you're doing relative to the return expectations that were set to help you reach your financial goals.
What impacts your personal rate of return?
To calculate your personal rate of return, we use the industry-defined "dollar-weighted" calculation, which factors in not only changes in the value of your investments over time, but also:
- Timing and amount of withdrawals and contributions – The net amount you've added to or withdrawn from the account during a particular period. This includes transfers in/out, cash added/withdrawn, buys/sells, any fees or commissions charged and taxes withheld.
- Investment cash flows – Net total of all cash flows for your investments, including dividend payments, interest payments and dividend reinvestments.
Let's take a look at an example of how to determine your net investment cash flow:
You buy XYZ stock for $1,000 on Jan. 2 and then buy $500 more on Feb. 1. XYZ stock then pays $50 in dividends, which you do not reinvest. On March 1, you sell $300 of XYZ stock. Your net investment cash flows will show as $1,150 ($1,000 + $500 - $50 - $300).
If you had reinvested the dividends, the total amount would increase:
Net investment cash flows would be $1,200 ($1,000 + $500 - $50 + $50 - $300).
How to calculate your personal rate of return
Here's an example:
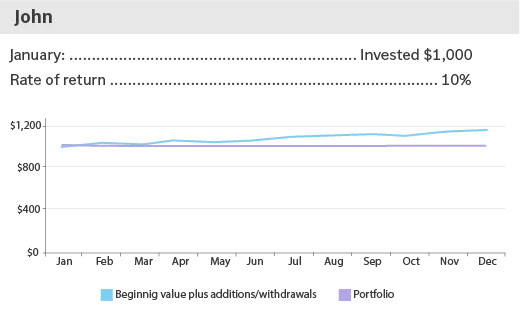
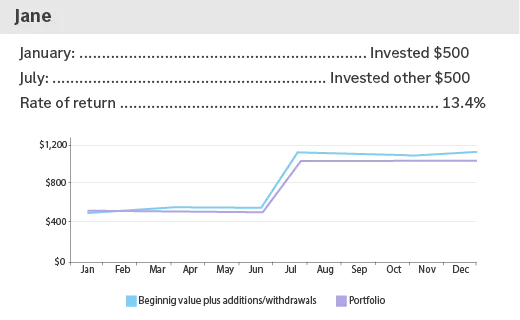
Within one year, John and Jane deposit and invest $1,000 and achieve a $100 gain, both ending the year with $1,100.
*Source Edward Jones
Jane's rate of return is higher because half of her deposit was not invested until July, which means her investments had to perform better to achieve that same $100 growth. The upward-trending blue line illustrates how the value of Jane's investments grew over time. Jane's personal rate of return is higher, at 13.4%, because half of her deposit was not invested until July, meaning her investments had to perform better to achieve that same $100 growth.
Image 1 shows John's personal rate of return, as he initially invests $1,000 at the beginning of a 12-month period. The green line depicts the dollar amounts John added to or took out of the portfolio, which remains flat, since he did not add to or withdrawal from his initial $1,000 investment. The upward-trending blue line illustrates how the value of John's investment grew over time. Because John made no additional investments or withdrawals besides his initial $1,000 investment, his personal rate of return is identical to the dollar percentage, 10%.
Image 2 shows Jane's personal rate of return, as she initially invested $500 at the beginning of a 12-month period, with a second $500 deposit after six months. The green line depicts the dollar amounts Jane added or took out of the portfolio, which shows an uptick in July as Jane made her second $500 deposit.
The upward-trending blue line illustrates how the value of Jane's investments grew over time. Her personal rate of return is higher, at 13.4%, because half of her deposit was not invested until July, meaning her investments had to perform better to achieve that same $100 growth.
What time frame is used to calculate your personal rate of return?
Edward Jones tracks the performance of your investments since they have been held in the current account, but no earlier than Jan. 1, 2009. This also includes investments you owned during this period but have since sold. Certain events, including a transfer of an investment between accounts, share class conversion or change in an investment's identification code (CUSIP) caused by a corporate action, will affect the time frame over which the investment's rate of return is calculated. When evaluating your personal rate of return, longer periods of time – rather than short-term performance – provide a better indication of how an investment is performing.
What is an annualized rate of return?
Your personal rate of return may be displayed as an annualized rate of return, which reflects the average annual return of your portfolio since its inception. For example, if you invested $100 five years ago, reinvested all dividends and capital gains, and it is now worth $200, the return for your entire holding period would be 100%, with an annualized return of 14.87%. (Simple math may lead you to divide 100% by 5 years to get a 20% return per year, but this would not be an accurate annualized return because of compounding. Compounding occurs because you reinvested the money earned in year 1, allowing that money to grow in year 2 along with your initial $100 investment.)
3. Understand the reasons behind your performance
There are plenty of reasons your portfolio is performing the way it is – the market environment, individual investment performance, the mix of the investments you own, how long you've held your investments – or, more likely, a combination of these factors. In any case, a discussion with your financial advisor can help keep you informed. He or she can help you connect what’s happening in the market – and even in your life – to your portfolio.
For timely information on the market and investing, see our guidance and perspectives section.
The challenges of comparing your performance to a market index
Some investors compare their portfolio's returns to a single index, such as the S&P 500. Though single market indexes can provide insight into the performance of stocks and bonds overall, they are usually not a relevant comparison to your own portfolio's performance. Here's why:
- A market index is not based on your goals or your risk tolerance - If your goal was to produce income for retirement, you’d likely allocate a larger portion to fixed income. Therefore, it wouldn’t be appropriate to compare your returns to those of a stock index.
- Indexes are generally not diversified across different types of investments - This means they often can have wider swings in value. And to realize the extreme highs of an index, you must also be willing to accept the extreme lows.
- Your performance will be affected by your contributions and withdrawals while the index performance isn't - Investing also involves expenses and fees, and the index performance typically does not include those costs.
4. Stay up-to-date
We recommend reviewing your goals and objectives with your financial advisor at least once a year, as well as when there are changes to your personal situation. In addition, Edward Jones' investment professionals provide a variety of market outlooks and financial planning strategies that could help put you more in control of reaching your financial goals.
Your Edward Jones financial advisor can help you review your current performance in the context of your long-term goals and our expectations for future performance. More important, you’ll review how that performance affects your progress toward your long-term goals, with a focus on what you can control, to determine if any changes need to be made to keep you (or put you back) on track.
Important information:
Past performance is not a guarantee of future results.
Investors should understand the risks involved in owning investments, including interest rate risk, credit risk and market risk. The value of investments fluctuates and investors can lose some or all of their principal.