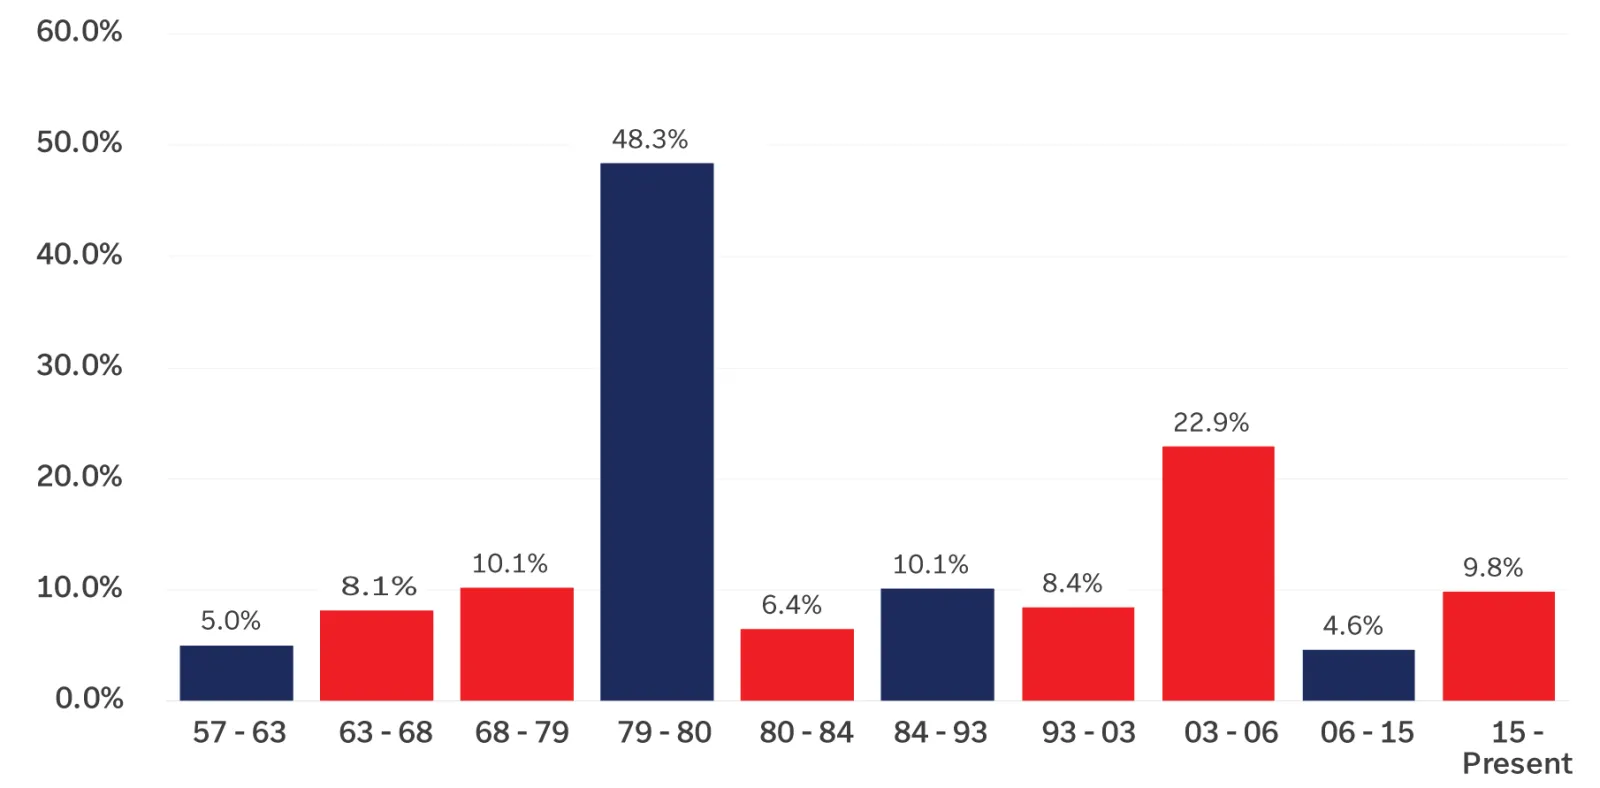
This chart shows that the TSX has posted positive returns between elections since 1957, regardless of which party is in power.
This chart shows that the TSX has posted positive returns between elections since 1957, regardless of which party is in power.
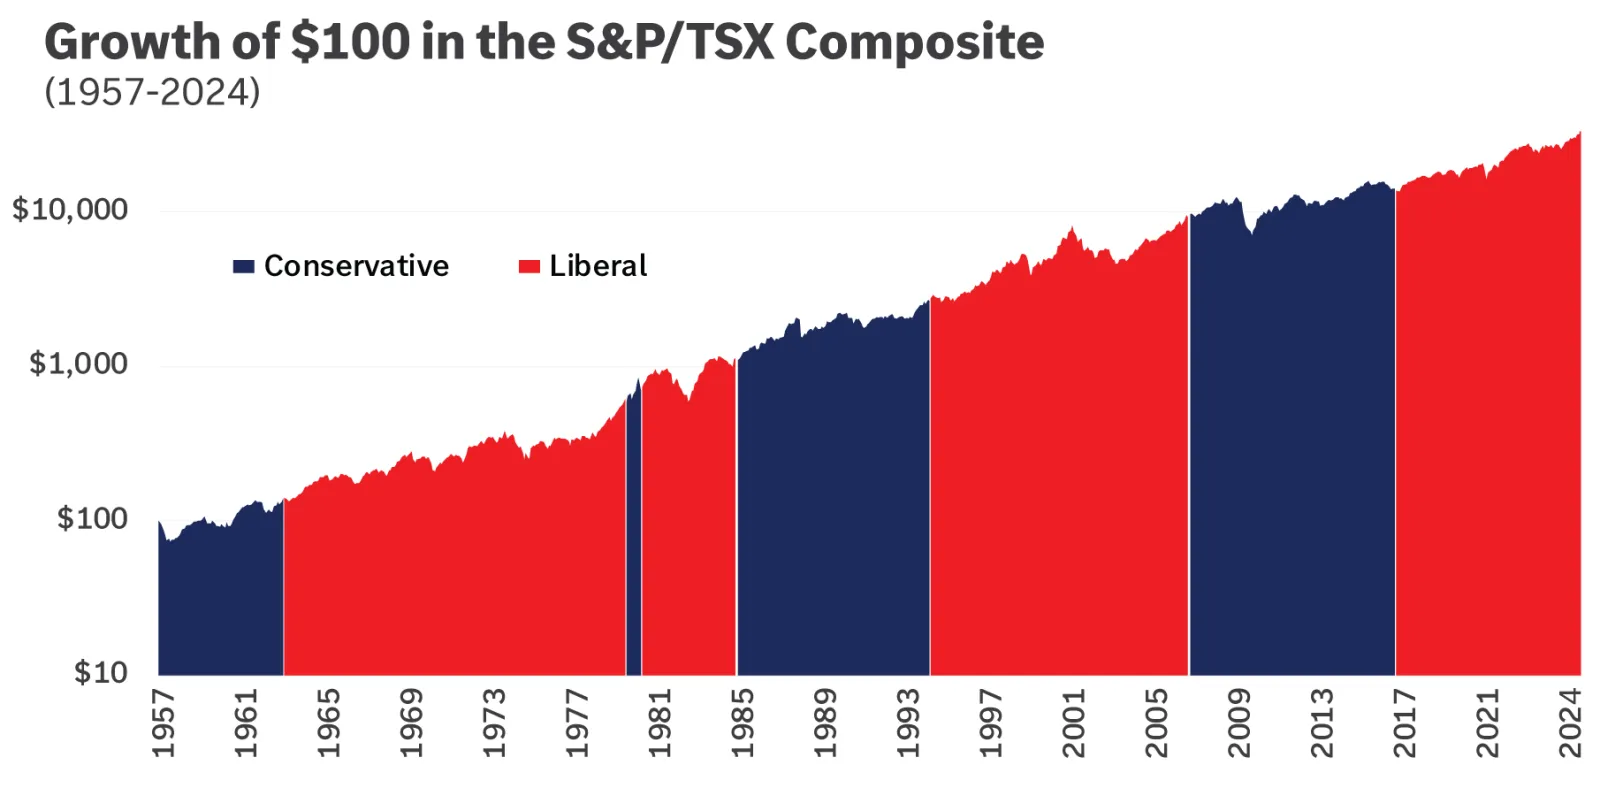
This chart shows the growth of $100 invested in the S&P/TSX Composite from 1957 to 2024.
This chart shows the growth of $100 invested in the S&P/TSX Composite from 1957 to 2024.
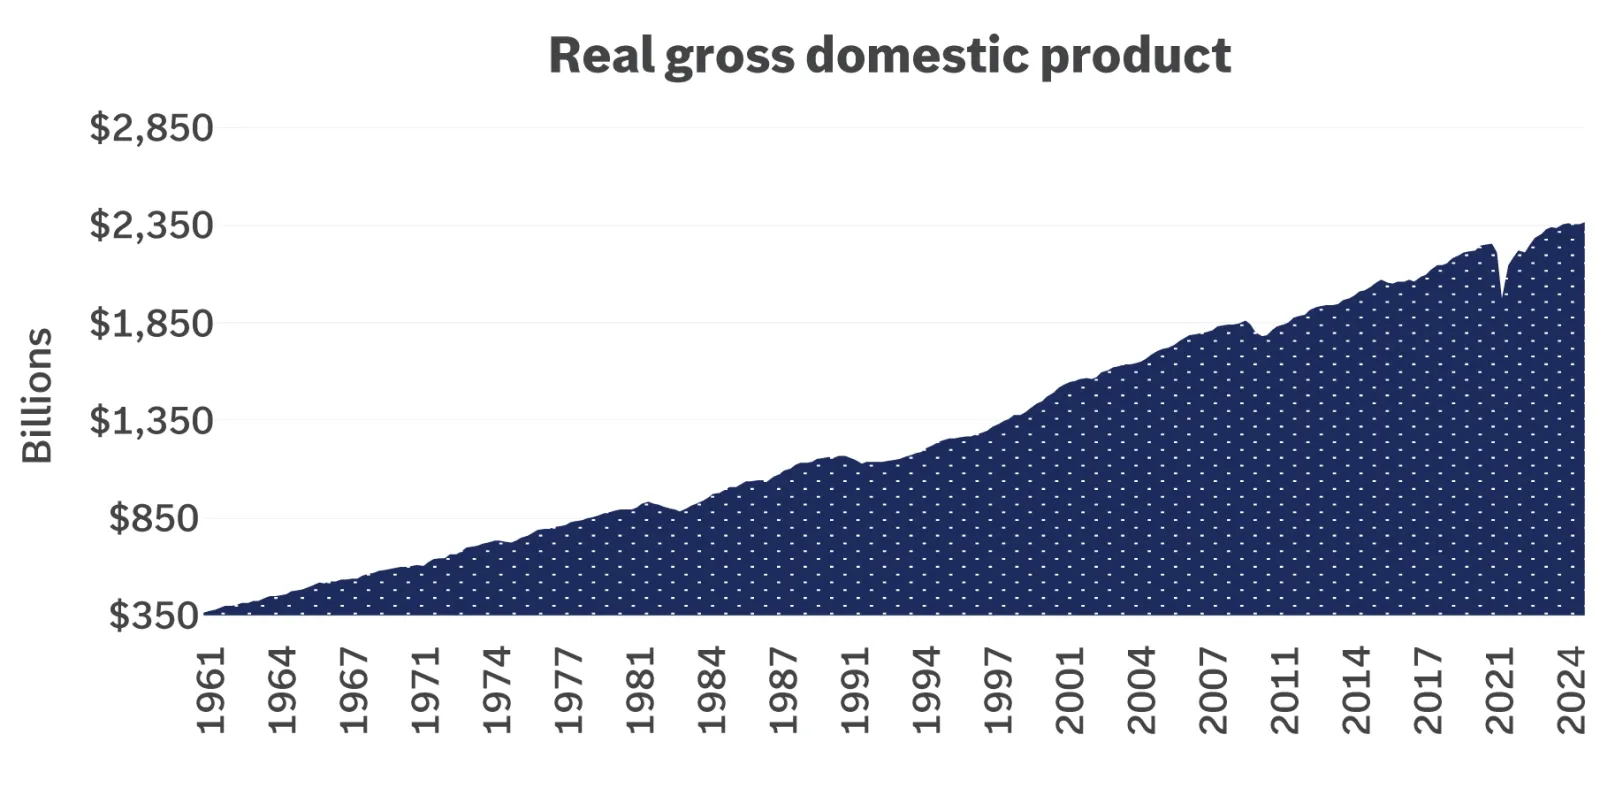
This chart shows the Canadian economy’s long-term trend as measured by real gross domestic product, and depicts a fairly good record over a variety of political environments.
This chart shows the Canadian economy’s long-term trend as measured by real gross domestic product, and depicts a fairly good record over a variety of political environments.
Important information:
1 Source: Morningstar Direct. Total return of the S&P/TSX Composite 1/1/1977 – 10/31/2024. The S&P 500 is an unmanaged index, cannot be invested in directly and is not meant to depict an actual investment. Past performance is not a guarantee of future results.