2025 offered key insights for Canadian investors navigating a shifting economic landscape. Here's a data-driven look at the year that was.
Bank of Canada policy rate
After cutting the policy rate in March, the Bank of Canada paused as countries reacted to the U.S. government's stance on global trade. While Canada continues to work on a trade deal with the U.S., the Bank of Canada recently cut the policy rate by 25 basis points in both September and October, as it attempts to contain inflation while spurring economic growth.
| October 2023 | October 2024 | October 2025 | |
|---|---|---|---|
Policy rate | 5.00% | 3.75% | 2.25% |
Canadian inflation rate
Year over year inflation data corroborates the Bank of Canada’s policy stance as inflation has returned to their target range of 1 to 3%. While these point-in-time datapoints don’t tell the whole story, total inflation appears contained while food inflation remains a concern for many Canadians.
| September 2023 | September 2024 | September 2025 | |
|---|---|---|---|
| Inflation rate* | 3.8% | 1.6% | 2.4% |
| Food inflation | 5.8% | 2.4% | 3.8% |
*Total CPI, year over year.
U.S. to Canada exchange rate
The Canadian dollar (CAD) continues to weaken against the U.S. dollar (USD). While a weaker Canadian dollar can help domestic manufacturers compete globally, tariffs on Canadian goods to the U.S. have outweighed this weakness. A weaker Canadian dollar can also attract foreign investment and boost tourism, having a positive impact on economic growth. The weak dollar does have drawbacks for those importing goods priced in USD or those looking to travel to the U.S. or some other countries. This pricing pressure increases costs to Canadians in the form of inflation.
| October 31, 2023 | October 31, 2024 | October 31, 2025 | |
|---|---|---|---|
USD/CAD | 1.3871 | 1.3916 | 1.4018 |
TSX Sector returns
The Toronto Stock Exchange (TSX) sector returns over the past year affirm the importance of diversification not only at the country level, but also at the sector level.
Sector | 1-month | 3-month | YTD Return* | 1-year |
|---|---|---|---|---|
Communication services | 0.30% | 0.30% | 0.30% | -4.40% |
Consumer discretionary | 1.60% | 3.10% | 19.90% | 20.60% |
Consumer staples | -1.20% | -1.70% | 4.40% | 11.30% |
Energy | -0.90% | 8.80% | 16.10% | 18.00% |
Financial services | 1.70% | 10.80% | 24.50% | 31.70% |
Health care | 4.30% | 17.40% | 3.30% | -5.00% |
Industrials | -0.70% | -1.50% | 3.90% | 5.00% |
Materials | -5.00% | 30.90% | 70.40% | 56.50% |
Real estate | -4.00% | -1.40% | 6.60% | 1.10% |
Technology | 13.80% | 23.40% | 36.20% | 67.40% |
Utilities | 4.10% | 8.60% | 22.40% | 22.70% |
TSX | 1.0% | 11.7% | 25.1% | 28.7% |
*October 31, 2025
Maximum Canadian Pension Plan (CPP) benefits
CPP payments can begin as early as age 60 or delayed until age 70. Delaying collection could result in up to a 42% increase in payments. This decision should be part of a broader retirement income strategy.
Maximum CPP | 2023 | 2024 | 2025 |
|---|---|---|---|
Start at age 60 | $836.21 | $873.34 | $917.12 |
Start at age 65 | $1,306.57 | $1,364.6 | $1,433.00 |
Start at age 70 | $1,855.33 | $1,937.73 | $2,034.86 |
Maximum Old Age Security (OAS) pension benefits
Like CPP, OAS benefits can also be delayed until age 70 with an increased benefit amount of up to 36% Unlike CPP, OAS cannot begin before age 65 and is adjusted for inflation on a quarterly basis. OAS also provides an additional 10% for those aged 75 and over.
Maximum OAS | October-December 2023 | October-December 2024 | October-December 2025 |
|---|---|---|---|
Start at age 65 | $707.68 | $727.67 | $740.09 |
Start at age 70 | $962.44 | $989.63 | $1,006.52 |
Tax-free Savings Account (TFSA)
The 2025 TFSA contribution limit is $7,000 and will remain the same for 2026. Canadians who were 18 in 2009 will have a cumulative total of $109,000 of contribution room in 2026 assuming no withdrawals. Track your contributions and withdrawals to ensure you do not overcontribute. You can view your balance online by visiting My CRA Account.
Year | Maximum annual contribution | Cumulative contribution room |
|---|---|---|
2009 | $5,000 | $5,000 |
2010 | $5,000 | $10,000 |
2011 | $5,000 | $15,000 |
2012 | $5,000 | $20,000 |
2013 | $5,500 | $25,500 |
2014 | $5,500 | $31,000 |
2015 | $10,000 | $41,000 |
2016 | $5,500 | $46,500 |
2017 | $5,500 | $52,000 |
2018 | $5,500 | $57,500 |
2019 | $6,000 | $63,500 |
2020 | $6,000 | $69,500 |
2021 | $6,000 | $75,500 |
2022 | $6,000 | $81,500 |
2023 | $6,500 | $88,000 |
2024 | $7,000 | $95,000 |
2025 | $7,000 | $102,000 |
2026* | $7,000 | $109,000 |
*Next year's contribution limit.
First Home Savings Account (FHSA)
The FHSA was introduced in 2023, allows qualified individuals to save towards the purchase of a first home. Contributions to the account are tax-deductible, and funds grow in the account tax-free.
| Year | Maximum annual contribution |
|---|---|
2023 | $8,000 |
2024 | $8,000 |
2025 | $8,000 |
Canadian household disposable income, net savings and savings rate
Second quarter data from the past three years shows disposable household income continued to climb for all age groups, however the same is not true for household net savings and household savings rates. Canadians aged 45 to 54 saw a noticeable drop in net savings and savings rates, while those aged 65 and over have higher disposable incomes but have seemed to maintain a net spend of around $20,000 per year.
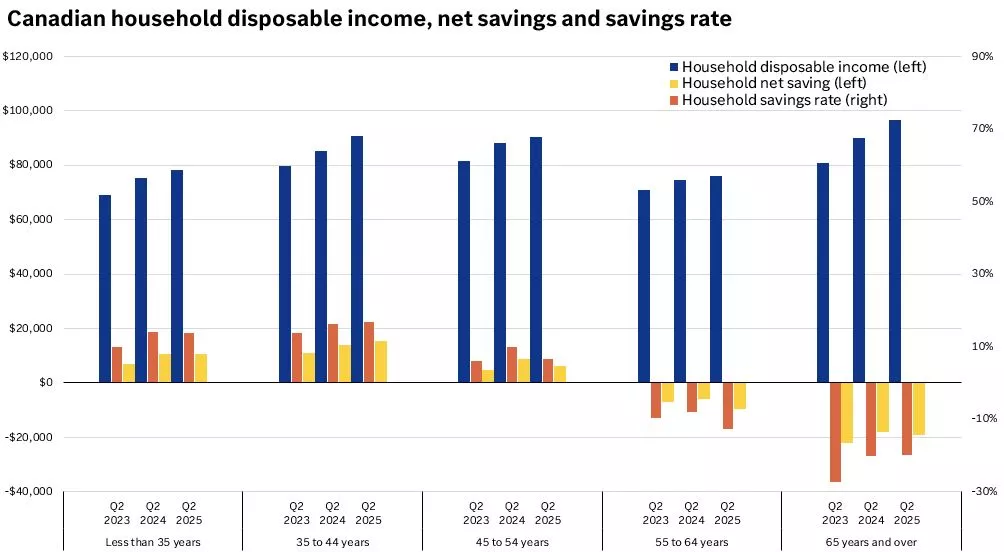
This chart shows that disposable household income climbed for all age groups in the second quarter of 2023, 2024 and 2025. Net savings and savings rates climbed for age groups up to 44 years, but dropped for those aged 45 years and older.
This chart shows that disposable household income climbed for all age groups in the second quarter of 2023, 2024 and 2025. Net savings and savings rates climbed for age groups up to 44 years, but dropped for those aged 45 years and older.
Net worth of Canadians by age group
Average net worth in Canada continues to climb within each age group.
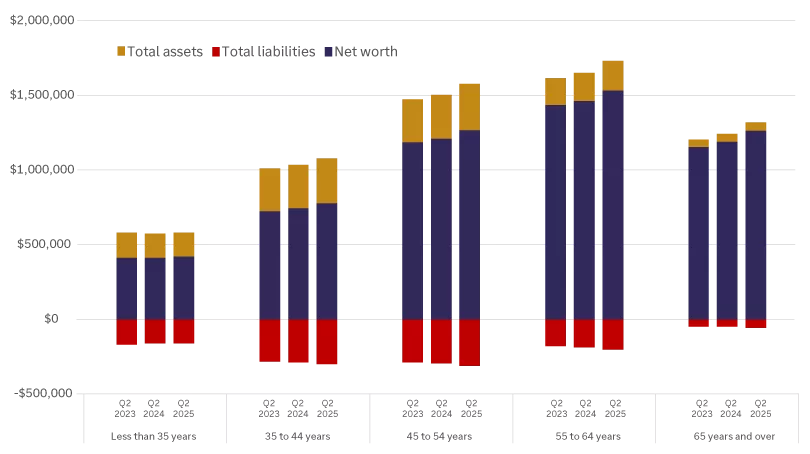
This chart shows that the net worth of Canadians in all age brackets has climbed over the last three years.
This chart shows that the net worth of Canadians in all age brackets has climbed over the last three years.
Canadian debt to income ratio
While average net worth is climbing, so is the debt-to-income ratio for Canadians 45 and over. A value of 200 indicates $2 of debt for every dollar of disposable income. Interestingly, those under 35 have seen this ratio decrease over the past three years. We can see a similar trend in those aged 35 to 44, although they have the highest ratio.
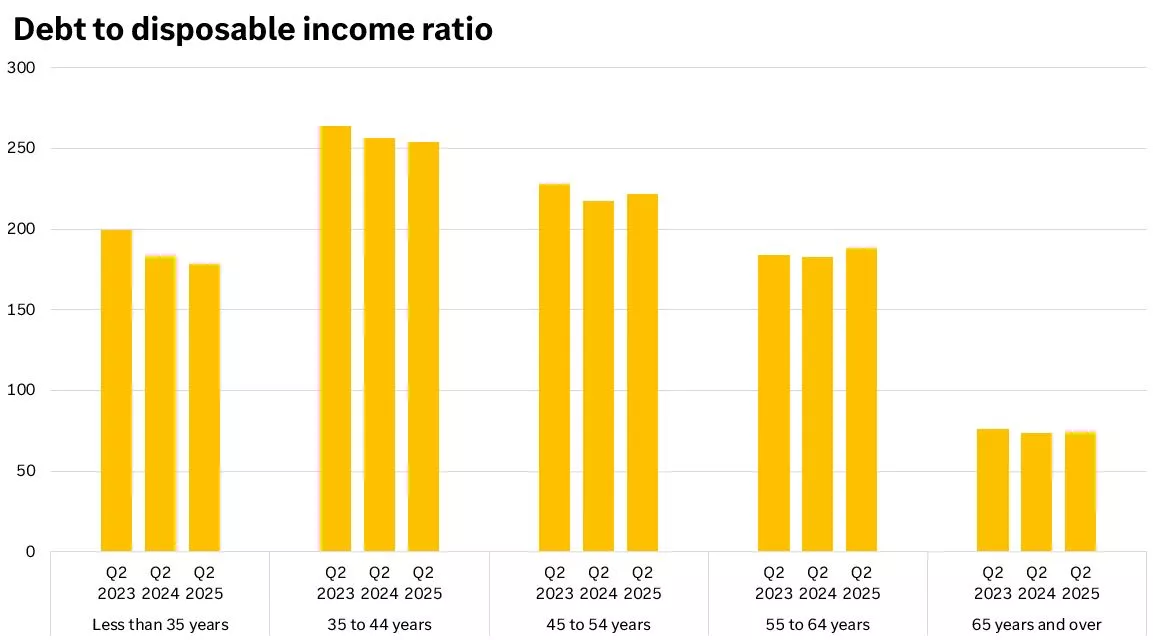
This chart shows that the debt-to-income ratio of Canadians in younger age brackets (less than 45 years) has decreased over the last three years, while that of those in older age brackets (45 years and older) declined last year, but rose again this year.
This chart shows that the debt-to-income ratio of Canadians in younger age brackets (less than 45 years) has decreased over the last three years, while that of those in older age brackets (45 years and older) declined last year, but rose again this year.