Weekly market wrap


Equity markets rebound on solid corporate earnings
Key takeaways
- Equity markets rebounded this past week, led by strong performance among technology and consumer discretionary stocks.
- The services sector of the economy — representing roughly 71% of the U.S. GDP — remains in expansion, though key readings continued to diverge in July.
- Labor-market productivity rose in the second quarter, helping to offset solid wage gains to keep unit labor costs contained relative to output.
- Corporate earnings have been stronger than expected, driving earnings growth estimates sharply higher to 9.7%, from 3.8% at the end of the second quarter.
- Bond yields rose, as Treasury auctions drew somewhat weaker demand, though the broader trend remains lower.
The services sector remains in expansion, though readings continued to diverge in July
The S&P U.S. Services Purchasing Managers' Index (PMI) rose to a new high for the year of 55.7 in July1. The reading was ahead of forecasts to hold steady at 55.22 and above the key 50.0 mark reflecting expansion. July's accelerated expansion was led by surging demand in the technology sector, along with higher financial services activity, aided by improving financial conditions1. Output prices rose as companies reported passing along tariff-related input-cost increases to customers1.
The Institute for Supply Management (ISM) Services PMI extended its broader trend lower, falling to 50.13, missing estimates of 51.32 but remaining in expansion territory. Slower growth in business activity was a key driver behind the drop3. While tariffs do not apply to services directly, the new exports and imports indexes moved to contraction, from expansion3, reflecting trade disruptions. Price pressures also continued, rising at the fastest pace since 20223.
Overall, the services sector — accounting for roughly 71% of U.S. GDP — remains in expansion territory. While the economy appears to be slowing, we don't expect a recession, and growth should reaccelerate in 2026, in our view, backed by fiscal stimulus, Fed rate cuts, deregulation and the potential for reduced trade tensions and uncertainty.
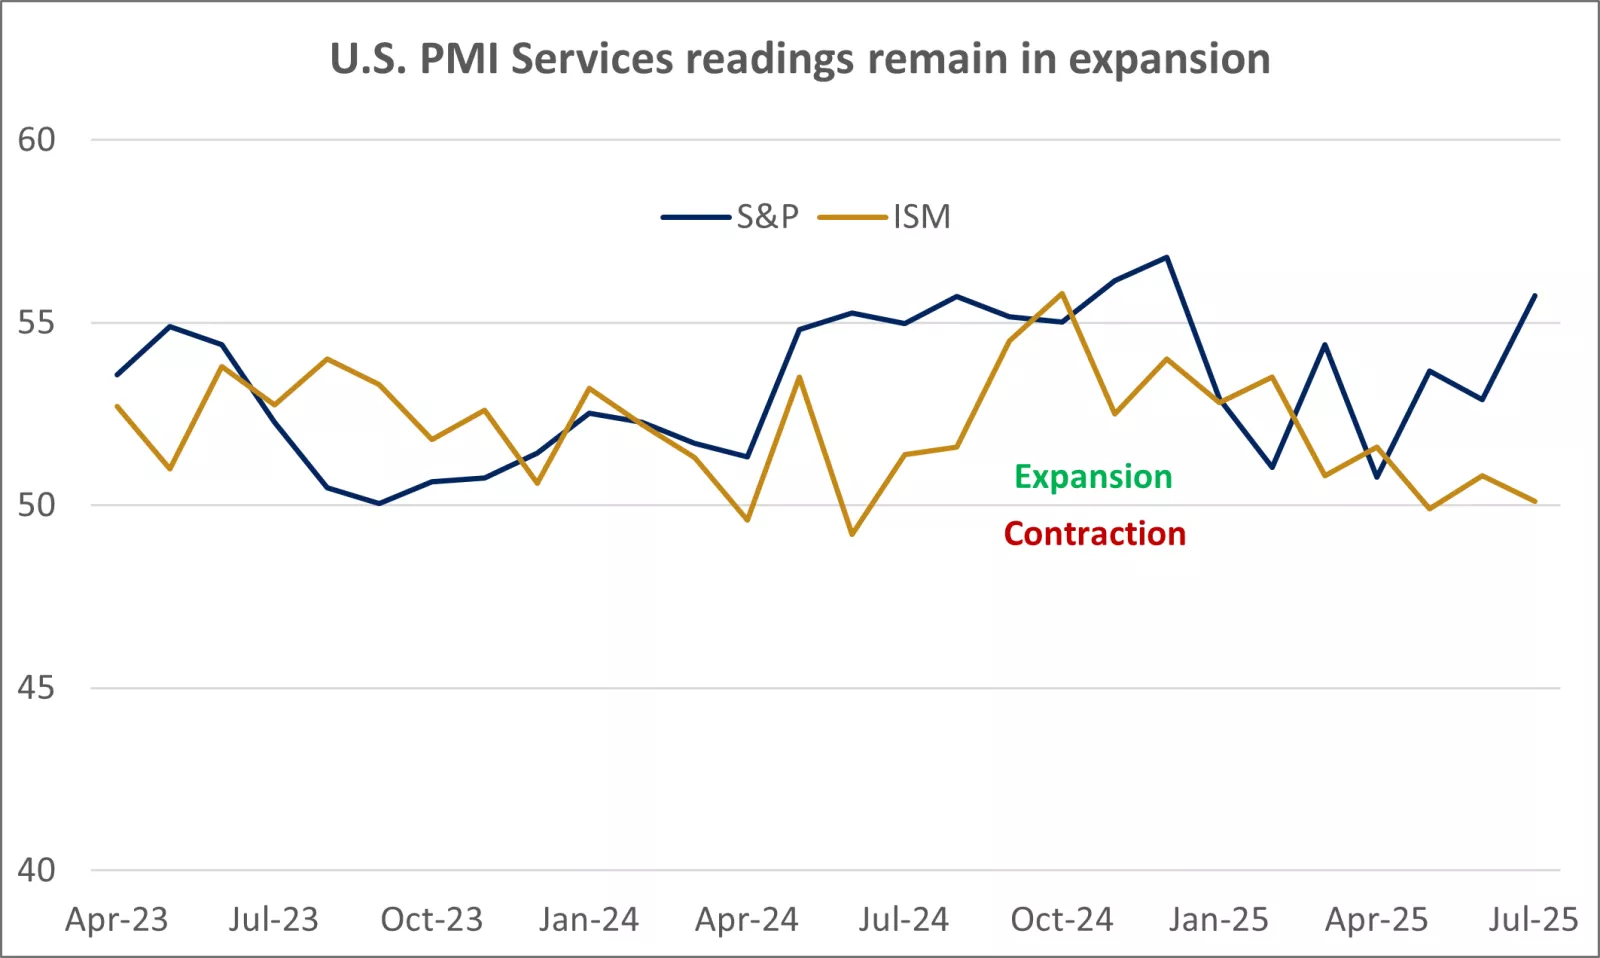
This chart shows the path of S&P and ISM U.S. PMI Services since 2023, with both readings remaining in expansion territory. Past performance does not guarantee future results.
This chart shows the path of S&P and ISM U.S. PMI Services since 2023, with both readings remaining in expansion territory. Past performance does not guarantee future results.
Labor productivity improves, helping to keep unit labor costs contained
Nonfarm business sector productivity increased at a 2.4% annualized pace in the second quarter, beating estimates pointing to a 2.2% rise2. Despite a softer labor market, hourly compensation grew a healthy 4.2% year-over-year, comfortably above inflation of about 2.7%2. This means consumers, on average, are receiving positive real wage gains, which should provide disposable income to help support consumer spending and the economy, in our view.
Productivity gains partially offset solid wage gains to keep unit labor costs, which adjust hourly wages for higher output, contained at 1.6% annualized2. We believe modest increases in unit labor costs, if sustained, should help counteract the impacts of tariffs on inflation.
Corporate earnings growth rises further on solid results
With 90% of S&P 500 companies reporting quarterly results, corporate earnings season is winding down. Walt Disney Company and McDonald's announced earnings that exceeded estimates2. Importantly, Walt Disney's revenue was about in line with forecasts, while that of McDonald's beat expectations2, indicating that, combined with other recent data, consumers appear to remain mostly resilient.
Earnings results have been stronger than expected, as 82% of S&P 500 companies have beaten analyst estimates, with an average upside surprise of 8.5%2. As a result, forecasts for earnings growth have been revised sharply higher to 9.7%, from 3.8% at the end of the quarter2, showing that prior downgrades appear to have been overdone.
Earnings growth has been led by the communications and technology sectors, both of which are higher more than 20% year-over-year2. Performance has been broad as well, as earnings are down for just two of the 11 sectors — energy and materials — which represent less than 5% of the market capitalization of the S&P 500. Earnings growth is forecast to slow over the quarters ahead but still combine for 10.1% growth for 2025, aided by the first quarter's strong 12.8% rise2. While we believe earnings could slow further as tariffs likely weigh on corporate profit margins, earnings should be sufficient to support stock prices over time, in our view.
Bond yields rise on Treasury auctions, though the broader trend remains lower
Bond yields rose this past week, as the Treasury auctioned $42 billion of 10-year notes and $25 billion of 30-year bonds that drew somewhat weaker demand. For the 10-year auction, total bids as a multiple of those accepted, known as the "bid to cover ratio," dipped to 2.35, compared with the year-to-date average of 2.574. While government budget deficit concerns are likely weighing on demand, the benchmark yield has fallen from its July peak near 4.5%.
Following last week's nonfarm-jobs report reflecting a slowing labor market, bond markets priced in expectations for the Fed to cut rates more quickly, likely resuming in September5, in part to help support the labor market.
In assessing the need and capacity to cut interest rates, the Fed will likely be constrained by its price-stability mandate. The Fed's preferred personal consumption expenditure (PCE) inflation measure rose to 2.6% annualized in June, from 2.2% in April2, presenting challenges for the Fed. While inflation remains above the 2% target, the fed funds rate — currently near 4.3% — likely remains restrictive. A neutral fed funds rate tends to be about 1% above inflation, providing room to bring rates down to a less restrictive policy stance, in our view.
Overall, we continue to expect 10-year Treasury yields to stay in the 4%-4.5% range, which aligns with our annual outlook at the beginning of this year. Fed rate cuts should push the short end of the yield curve lower, in our view, likely helping prevent intermediate-term yields from rising much further, unless inflation reaccelerates or economic growth increases significantly. Government budget deficit concerns could continue to weigh on auction demand, potentially preventing intermediate-term bond yields from falling much below 4%, unless growth cools further, which could flatten the yield curve.
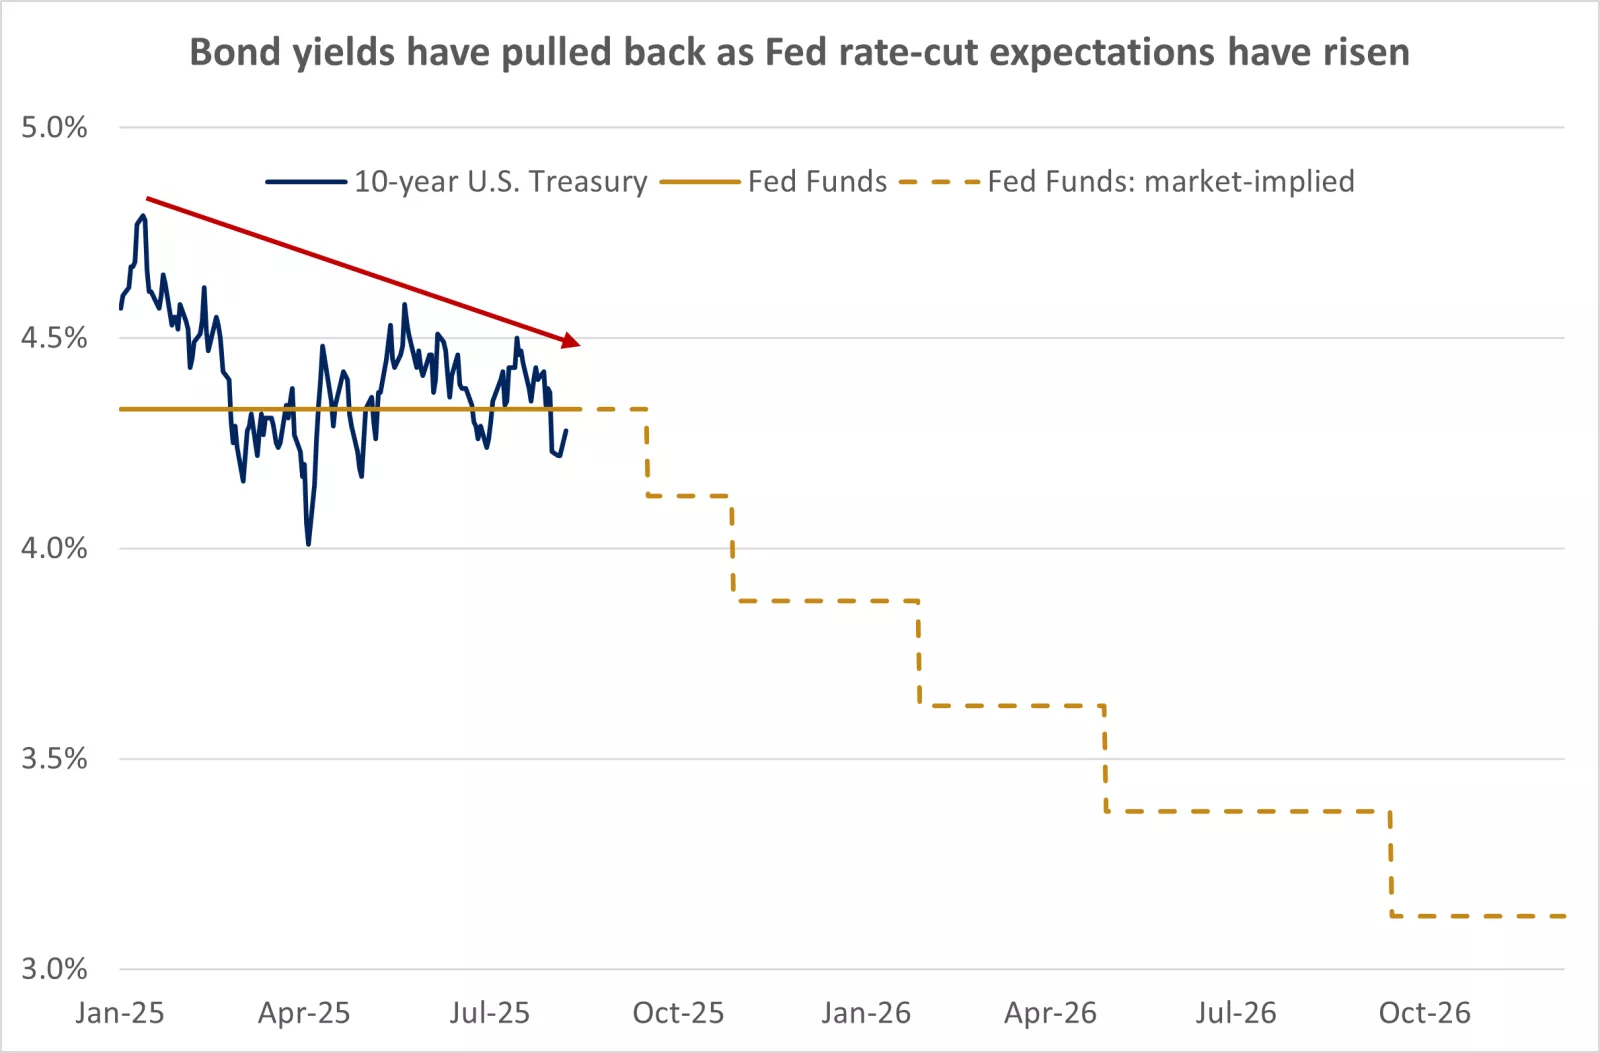
This chart shows the path of the 10-year Treasury yield and fed funds rate this year and market-implied expectations for fed funds through 2026. Past performance does not guarantee future results.
This chart shows the path of the 10-year Treasury yield and fed funds rate this year and market-implied expectations for fed funds through 2026. Past performance does not guarantee future results.
Higher tariffs take effect, new semiconductor tariffs announced
With the tariff pause expiring on August 7, higher tariff rates took effect this past week. Tariffs for most U.S. trading partners rise from the 10% baseline set back in April. While tariffs vary widely from 10% to up to 50%, most countries face import taxes in the 10%-20% range, as shown in the chart below.
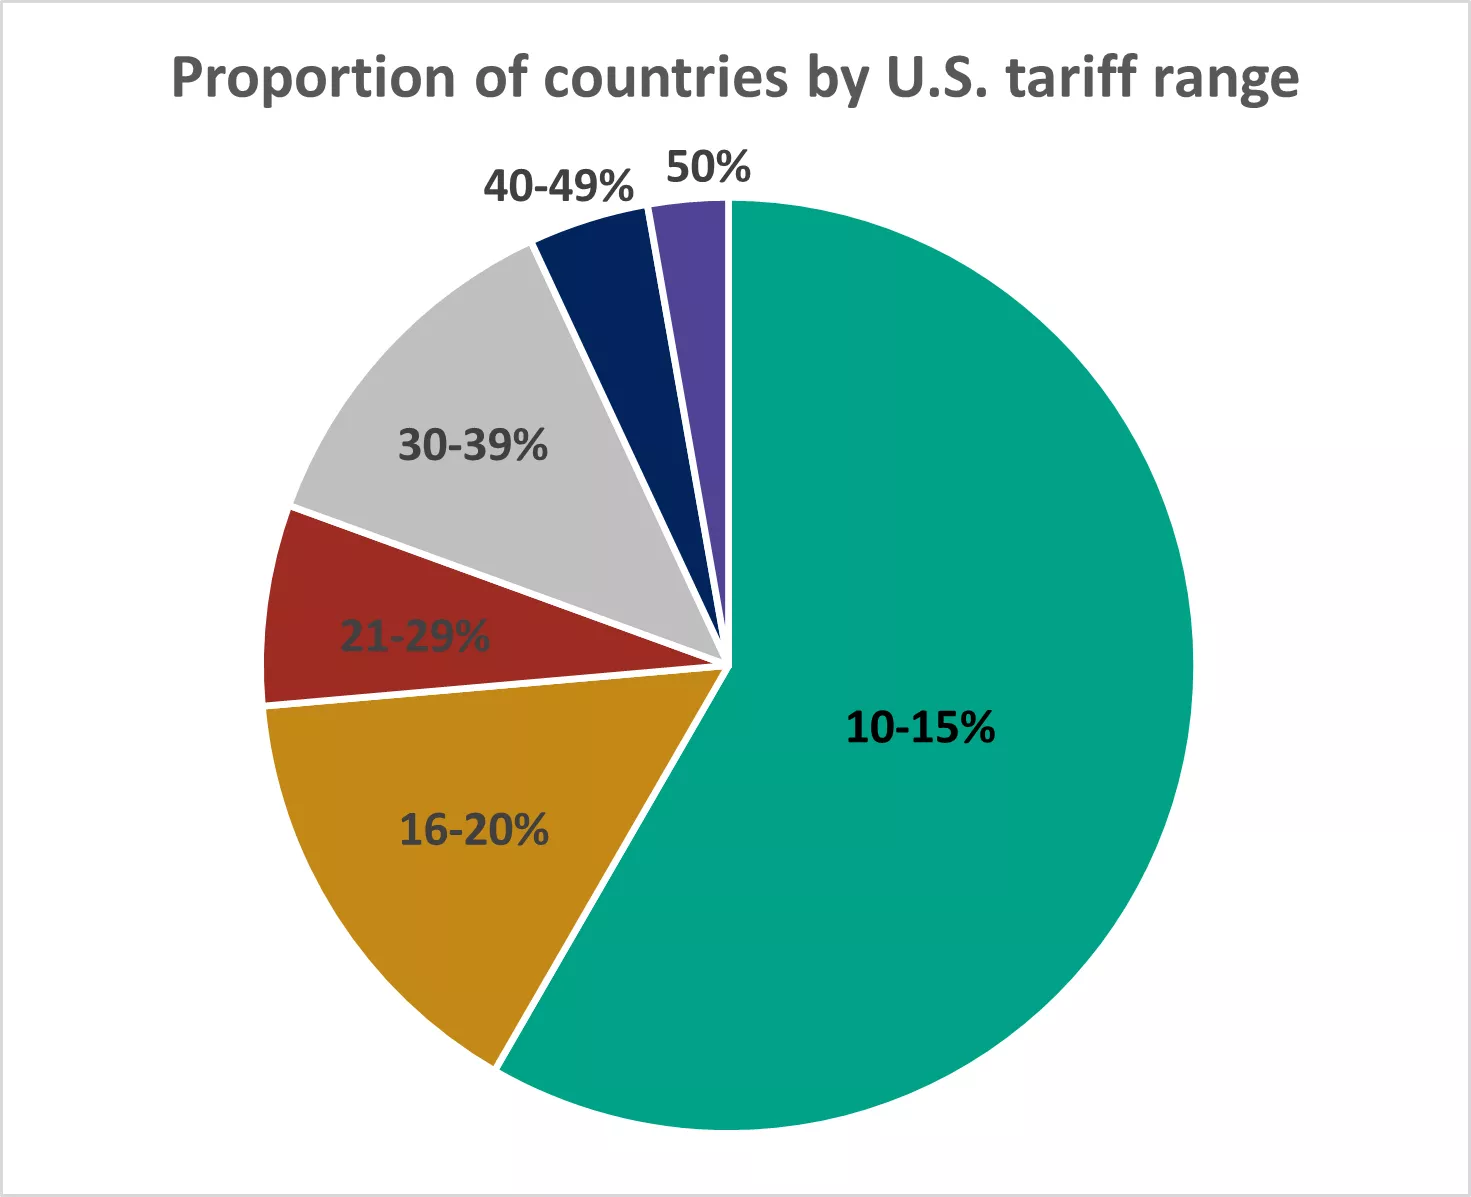
This chart shows the proportion of countries by ranges of U.S. tariff rates.
This chart shows the proportion of countries by ranges of U.S. tariff rates.
President Trump also announced new 100% tariffs on semiconductors (computer chips), though exemptions were more generous than expected. Companies with at least some production in the U.S. will reportedly receive exemptions, which should reduce effective tariff rates significantly from the headline 100% figure, in our view.
Higher tariffs could squeeze household purchasing power and corporate profit margins, potentially weighing on consumption and investment. However, the impact should be limited to near-term price hikes that aren't an ongoing source of inflation over the long term, in our view. Any additional progress in finalizing trade agreements should further ease trade tensions, in our view, and we think any flexibility in lowering tariffs should help contain inflation and growth risks.
Positioning for what's ahead
While the economy appears to be slowing, we expect a reacceleration in 2026 and 2027, supported by tailwinds of fiscal stimulus, Fed rate cuts, deregulation, and the potential for reduced trade tensions and uncertainty. We recommend overweight allocations to U.S. large-cap and mid-cap stocks, which we believe should perform well in this environment. Within U.S. stocks, we favor the consumer discretionary, financial services and health care sectors. The strong performance of international stocks this year, driven by the pullback in the U.S. dollar, highlights the importance of maintaining allocations beyond the U.S. However, we suggest an underweight position in international developed-market large-cap stocks.
Within U.S. investment-grade bonds, consider extending duration. Bonds in the seven- to 10-year range can offer the opportunity to lock in yields for longer and the possibility of price appreciation as the Fed likely resumes rate cuts, with potentially less sensitivity to deficit concerns than long-term bonds.
With U.S. stocks near record highs, valuations appear somewhat less attractive. We believe corporate earnings growth will be essential to drive further gains over the remainder of the year. Focusing on quality can take on even greater importance, in our view, as markets may experience volatility if economic data softens in the months ahead or trade tensions persist for a while longer. We believe the fundamental backdrop remains intact, and pullbacks can offer opportunities to invest at better prices or to rebalance to maintain diversification.
Weekly market stats
| INDEX | CLOSE | WEEK | YTD |
|---|---|---|---|
| Dow Jones Industrial Average | 44,176 | 1.3% | 3.8% |
| S&P 500 Index | 6,389 | 2.4% | 8.6% |
| NASDAQ | 21,450 | 3.9% | 11.1% |
| MSCI EAFE * | 2,679.76 | 0.5% | 18.5% |
| 10-yr Treasury Yield | 4.28% | 0.1% | 0.4% |
| Oil ($/bbl) | $63.60 | -5.5% | -11.3% |
| Bonds | $98.94 | -0.2% | 4.6% |
Source: Factset, (8/8/2025). Bonds represented by the iShares Core U.S. Aggregate Bond ETF. Past performance does not guarantee future results. *Morningstar Direct (8/10/2025)
The week ahead
Important economic releases this week include inflation, retail sales and an update on consumer sentiment.
Review last week's weekly market update.
Brian Therien
Brian Therien is a Senior Fixed Income Analyst on the Investment Strategy team. He analyzes fixed-income markets and products, and develops advice and guidance to help clients achieve their long-term financial goals.
Brian earned a bachelor’s degree in finance from the University of Illinois at Urbana–Champaign, graduating with honors. He received his MBA from the University of Chicago Booth School of Business.
Important Information:
The Weekly Market Update is published every Friday, after market close.
This is for informational purposes only and should not be interpreted as specific investment advice. Investors should make investment decisions based on their unique investment objectives and financial situation. While the information is believed to be accurate, it is not guaranteed and is subject to change without notice.
Investors should understand the risks involved in owning investments, including interest rate risk, credit risk and market risk. The value of investments fluctuates and investors can lose some or all of their principal.
Past performance does not guarantee future results.
Market indexes are unmanaged and cannot be invested into directly and are not meant to depict an actual investment.
Diversification does not guarantee a profit or protect against loss in declining markets.
Systematic investing does not guarantee a profit or protect against loss. Investors should consider their willingness to keep investing when share prices are declining.
Dividends may be increased, decreased or eliminated at any time without notice.
Special risks are inherent in international investing, including those related to currency fluctuations and foreign political and economic events.
Before investing in bonds, you should understand the risks involved, including credit risk and market risk. Bond investments are also subject to interest rate risk such that when interest rates rise, the prices of bonds can decrease, and the investor can lose principal value if the investment is sold prior to maturity.