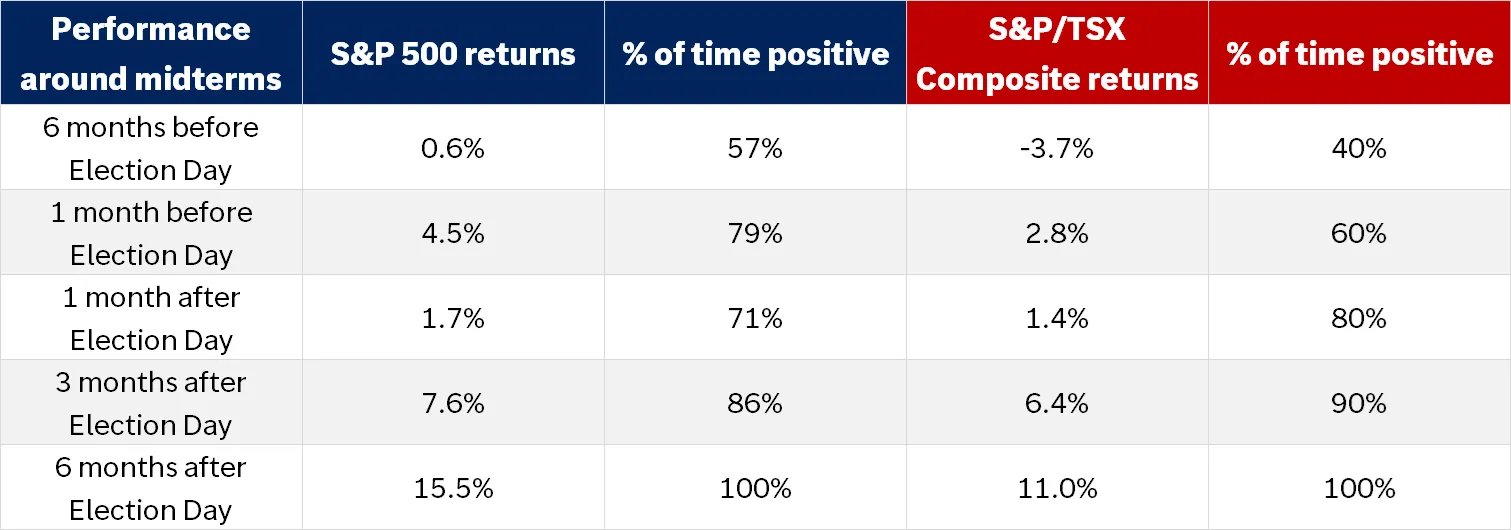
The table shows S&P 500 and TSX total returns around the U.S. midterm election day. S&P 500 returns are since 1970 while TSX returns are since 1986.
The table shows S&P 500 and TSX total returns around the U.S. midterm election day. S&P 500 returns are since 1970 while TSX returns are since 1986.
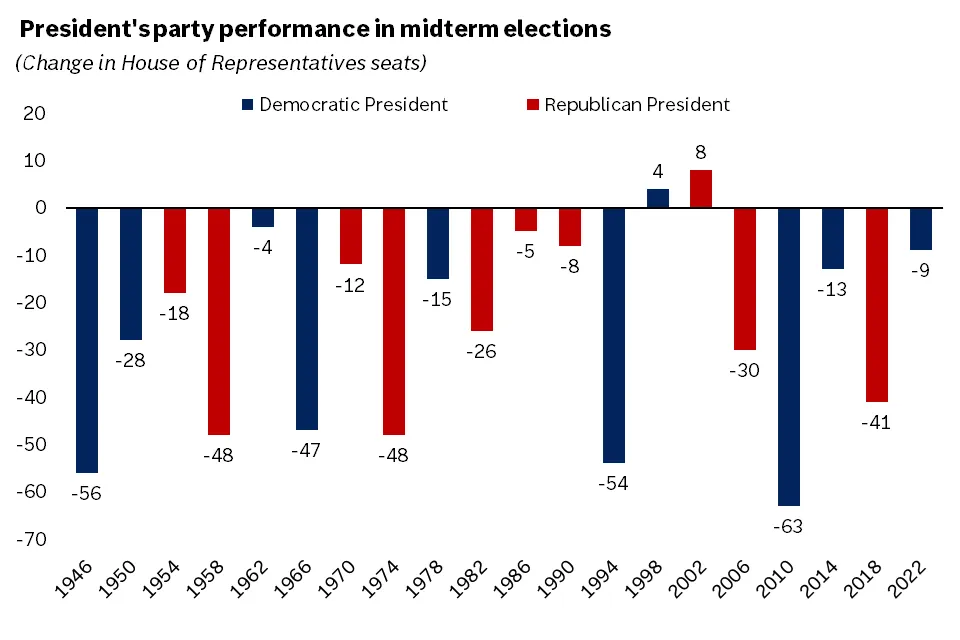
The graph shows the change in House seats for the party holding the White House immediately following each midterm election. The president's party has lost seats in 18 of the last 20 midterm elections.
The graph shows the change in House seats for the party holding the White House immediately following each midterm election. The president's party has lost seats in 18 of the last 20 midterm elections.
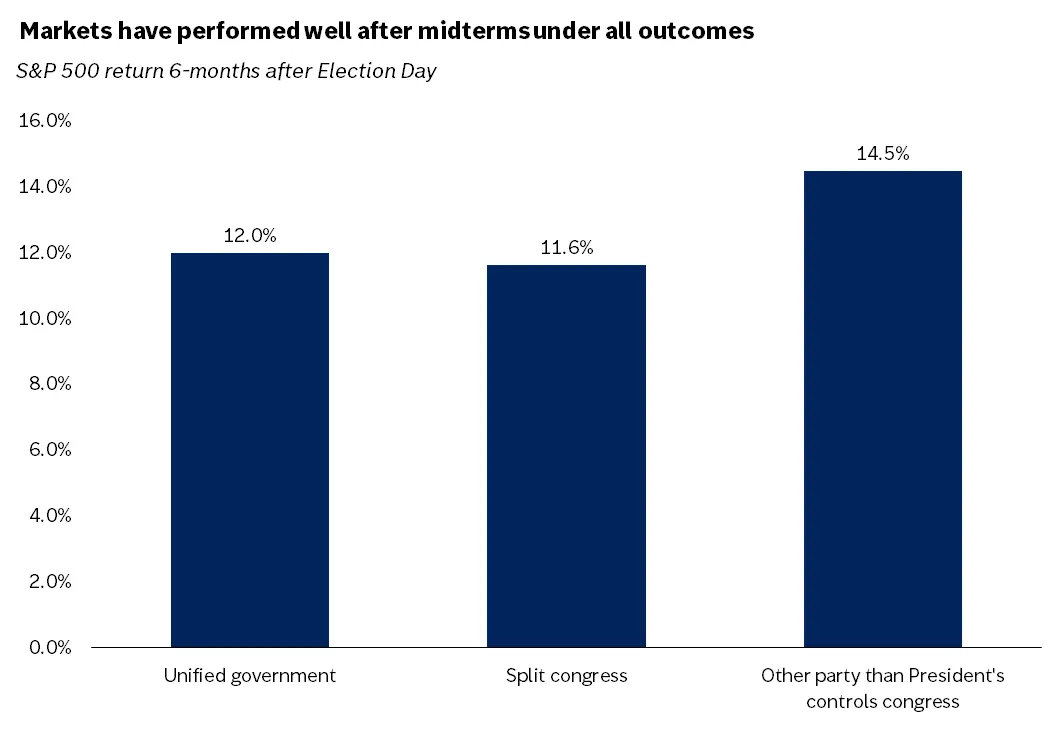
The graph shows that since 1970 S&P 500 performance has been consistent regardless of whether the outcome of the midterm elections resulted in unified government, a split Congress, or divided government between the White House and Congress.
The graph shows that since 1970 S&P 500 performance has been consistent regardless of whether the outcome of the midterm elections resulted in unified government, a split Congress, or divided government between the White House and Congress.
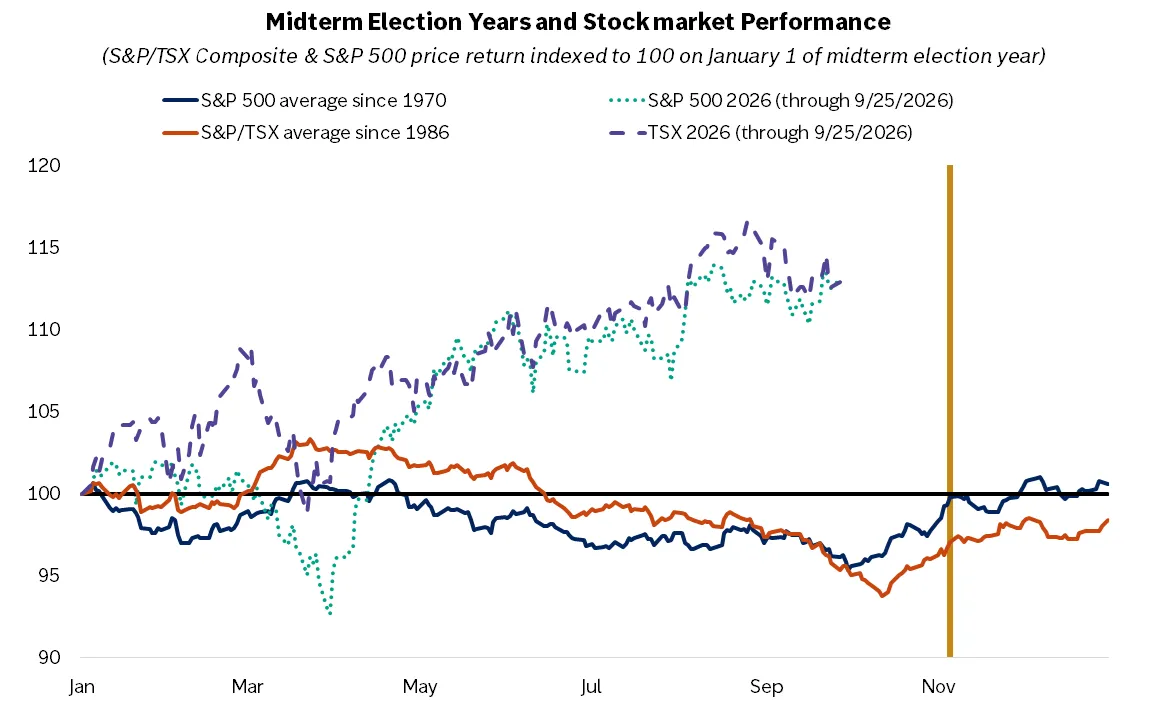
The chart compares the average S&P 500 performance during midterm election years since 1970 with 2026 and TSX returns since 1986 with 2026.
The chart compares the average S&P 500 performance during midterm election years since 1970 with 2026 and TSX returns since 1986 with 2026.
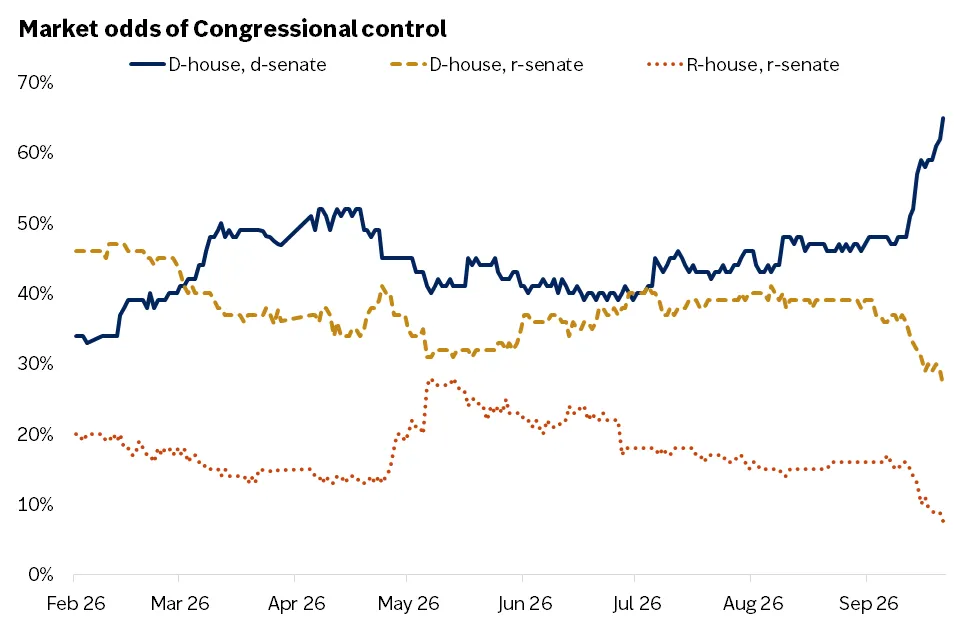
The graph shows the odds from prediction market Kalshi for the different congressional outcomes.
The graph shows the odds from prediction market Kalshi for the different congressional outcomes.
Important Information:
This is for informational purposes only and should not be interpreted as specific investment advice. Investors should make investment decisions based on their unique investment objectives and financial situation. While the information is believed to be accurate, it is not guaranteed and is subject to change without notice.
Before investing in bonds, you should understand the risks involved, including credit risk and market risk. Bond investments are also subject to interest rate risk such that when interest rates rise, the prices of bonds can decrease, and the investor can lose principal value if the investment is sold prior to maturity.
Investors should understand the risks involved in owning investments, including interest rate risk, credit risk and market risk. The value of investments fluctuates and investors can lose some or all of their principal.
Past performance does not guarantee future results.
Market indexes are unmanaged and cannot be invested into directly and are not meant to depict an actual investment.
Diversification does not guarantee a profit or protect against loss in declining markets.
Dividends may be increased, decreased or eliminated at any time without notice.
Special risks are inherent in international investing, including those related to currency fluctuations and foreign political and economic events.
Investing in equities involves the risk of loss. The value of an investors shares can fluctuate, and investors can lose money. Small-and mid-cap stocks tend to be more volatile than large company stocks.